
Company Overview: Telecommunications infrastructure company, Chorus Limited (NZX: CNU) maintains and builds a network made up of local telephone exchanges, cabinets, and copper and fiber cables. Its product portfolio comprises a range of wholesale broadband, data, and voice services across a mix of regulated, contracted, and commercial products. Its products include fiber broadband, fiber premium, copper-based voice, data services over copper and copper-based broadband. Its fiber and copper connections provide access to the Chorus fixed lines network to enable connections to the Internet. Its infrastructure includes the physical storage and site-sharing rental services for the co-location of the third party or shared assets. Its field services include services in the field to protect, strengthen, and increase the available network.

CNU Details


Provider of Fixed Line Communication Infrastructure: Chorus Limited (NZX: CNU) is New Zealand’s largest telecommunications infrastructure company. The company has a market capitalisation of ~$3.67 billion as on November 30, 2020.
Results Performance (Year Ended 30 June 2020)
The company reported revenue of $959 million in FY20 as against $970 million of FY19. This reflects on a reduction of 35,000 total fixed-line connections which was partly offset by an increase of 10,000 broadband connections over the previous year as customers migrated to fibre and wireless networks. EBITDA of $648 million for the period recorded an increase of $12 million on the previous year (FY19). This is despite operational restrictions post outbreak of COVID-19. Net earnings for the year decreased by $1 million and stood at $52 million. The FY20 results indicate the positive gains of a continued reduction in network maintenance costs and a decrease in annual regulatory levies. However, this was offset by a net $12 million blow to EBITDA from the lockdown. The suspension of non-essential field activity through the lockdown period had its negative bearing on the overall performance of the company. The company has decided to pay a dividend of 14 cents per share on 12 October 2020.
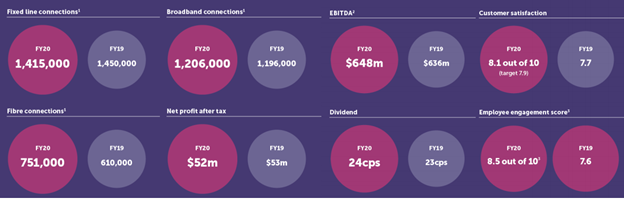
Snapshot of FY20 Results (Source: Company Reports)
Top 10 Shareholders: The top 10 shareholders have been highlighted in the table, which together forms around 40.65% of the total shareholding. L1 Capital Pty Ltd. and The Vanguard Group, Inc. are holding maximum stake in the company at 8.39% and 6.46%, respectively, as provided in the table below:
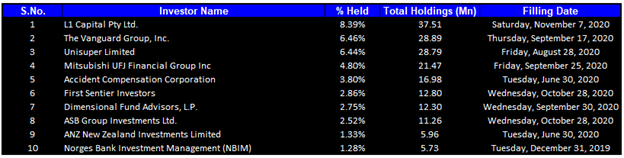
Top 10 Shareholders (Source: Refinitiv (Thomson Reuters))
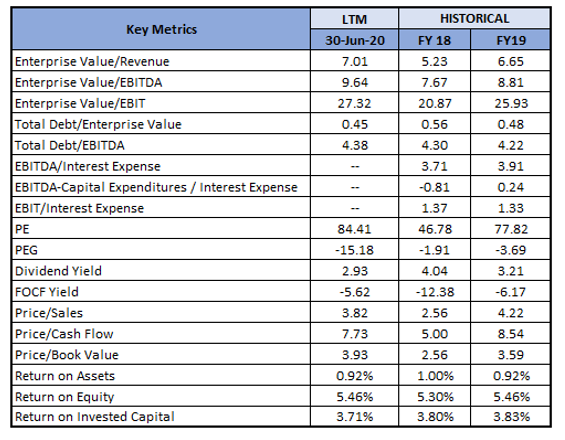
A Quick Look at Key Metrics: The company’s gross margin and EBITDA margin for FY20 stood at 68.9% and 75.5%, better than the industry median of 53.7% and 31.6%, respectively, implying decent fundamentals. ROE for FY20 stood at 5.5%, better than the industry median of 4.2%, implying that the company generated a better return for its shareholders than its peer group.
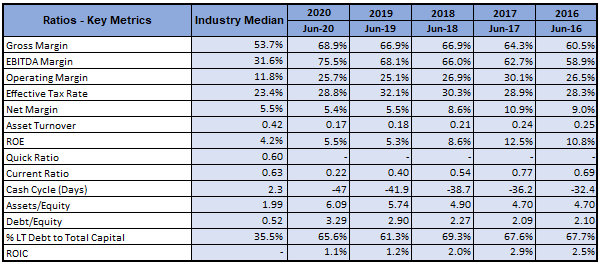
Key Metrics (Source: Refinitiv (Thomson Reuters))
Diversified Revenue Streams for FY20:
Revenue from Fibre broadband (GPON) and Fibre premium (P2P) for FY20 stood at $393 million and $73 million, respectively. Copper-based voice and Copper-based broadband revenues were at $82 million and $271 million, respectively, as compared to $106 million and $344 million in the previous year. The decline in the copper networks can be attributed to Chorus fibre or competing fibre or wireless networks.

Key Data (Source: Company Reports)
Sound Operational Performance (First Quarter Ended 30 September 2020)
The company’s fibre broadband connections increased by 33k, and Copper broadband and voice connections declined by 57k. The total broadband connections declined by 13k to 1,193,000, and total fixed-line connections declined by 25k to 1,390,000. Monthly average data usage per connection on the company’s network increased to 380GB in September 2020. In regards with the fibre, monthly average data usage per connection increased to 456GB while on copper it increased to 236GB.
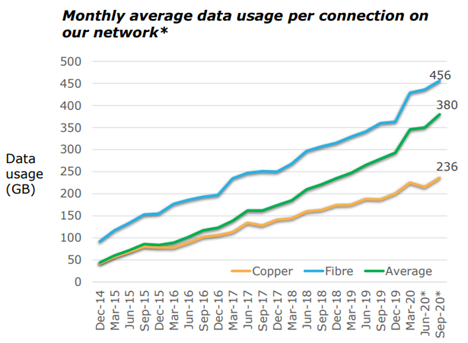
Monthly average data usage on fibre (Source: Company Reports)
Outlook:
While COVID-19 had a negative impact on the company’s FY20 EBITDA, it helped position fibre as the ‘new normal’ for internet connectivity. The company continues to explore opportunities to increase revenues through new products and services. It has shown interest in smart location connectivity, like CCTV cameras, traffic lights and digital advertising sites. It has also developed a service that makes it easier for retailers to expand their fibre services nationwide. The company sees great business potential with Wi-Fi standards, Wi-Fi 6 which is internationally considered to be an alternative to 5G.
The company has provided FY21 guidance of EBITDA to be in the range of $640 million to $660 million, Capital expenditure to be in the range of $630 million to $670 million and FY21 dividend to be 25 cents per share, subject to no material adverse changes in circumstances or outlook.
Industry Outlook:
New Zealanders’ demand for data has grown gradually partly driven by a decline in cost over the past ten years. The decline in the cost has been led by the innovation in technology for both fixed and mobile networks further supported by increasing smartphone penetration and the use of new applications. Data usage for fixed as well as mobile connections continued to increase over the year.
Key Valuation Metrics (Source: Refinitiv (Thomson Reuters))
Valuation Methodology:
Price to Cash Flow Multiple Based Relative Valuation (Illustrative)
.png)
Price to Cash Flow Multiple Based Relative Valuation (Source: Refinitiv (Thomson Reuters))
Note: All forecasted figures and peers have been taken from Thomson Reuters, NTM-Next Twelve Months.
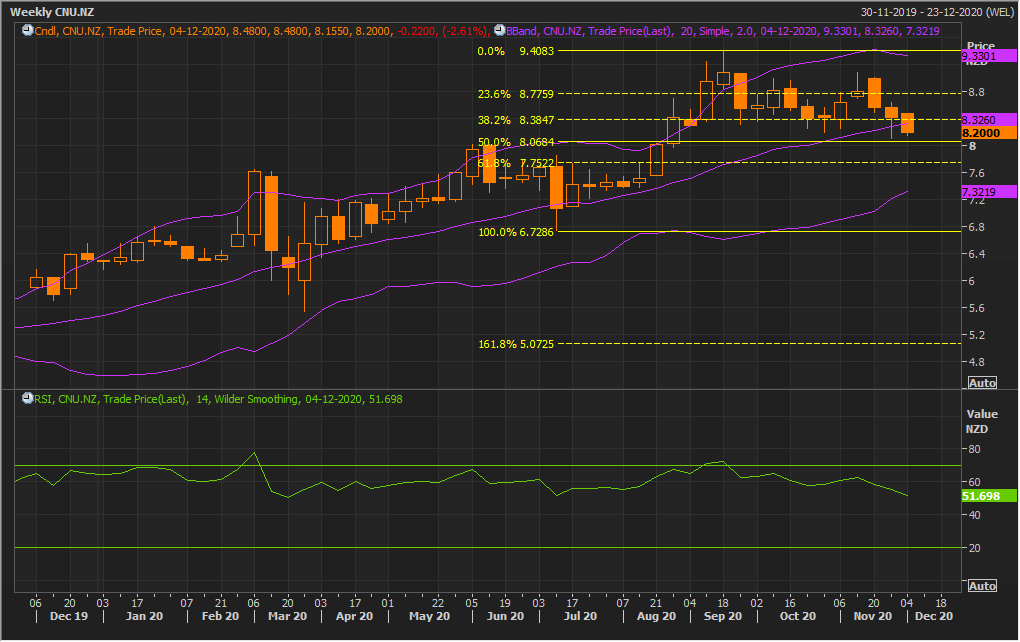
Technical Overview:
Weekly Chart –
Source: Refinitiv (Thomson Reuters)
Note: Purple colour lines are Bollinger Bands® with the upper band suggesting overbought status while the lower band oversold status, and yellow lines are Fibonacci retracement lines which measure price rebound and backtrack. https://www.bollingerbands.com/
The stock has come under selling pressure. The magnitude of sell-off is relatively higher for the ongoing week wherein it has given close with a loss of 2.61% on the first day of the trading session. The technical indicator RSI with a reading around 52 but a curve at the end pointing down, suggests a weakening of bullish momentum for the stock.
Going forward, the stock may have resistance around the 23.6% retracement level of $8.77 whereas support could be around the 61.8% retracement level of $7.75.
Stock Recommendation:
The company’s progress on optimizing its business and reducing costs, together with the broadband connection performance, has given it the confidence to keep FY21 EBITDA guidance at around similar levels to FY20.
Considering the aforesaid facts, we have valued the stock using Price to Cash Flow multiple based valuation (on an illustrative basis) and there are expectations that the stock price might witness a rise of low double-digit (in % terms).
Hence, we give a “Buy” recommendation on the stock at the current market price of NZ$8.200 per share, down by 2.61% on November 30, 2020.
.png)
CNU Daily Technical Chart (Source: Refinitiv (Thomson Reuters))
Disclaimer
Kalkine New Zealand Limited is authorised to provide class advice only. The information on this site does not take into account any of your investment objectives, financial situation or needs. Before you make a decision about whether to acquire a financial product, you should obtain the Product Disclosure Statement from the product issuer. You should consider the appropriateness of advice taking into account your own objectives, financial situation and needs and seek independent financial advice before making any financial decisions.
Past performance is not a reliable indicator of future performance.
 Please wait processing your request...