
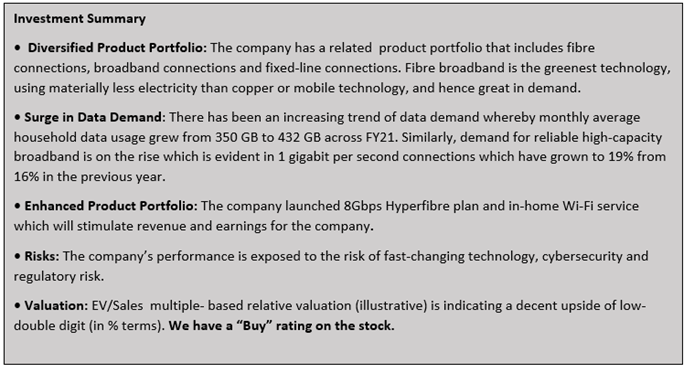
Company Overview: Chorus Limited (NZX: CNU) is a leading New Zealand-based telecommunications infrastructure company that builds a fibre network. A wide range of service providers uses this network to provide fixed-line phone, broadband and data services. The company’s product portfolio includes a broad range of wholesale broadband, data, and voice services across a mix of regulated and commercial products. The company’s strategy is focused on developing long-term future of its business, growing new revenues, optimising non-fibre business, and wining core fibre business.
CNU Details
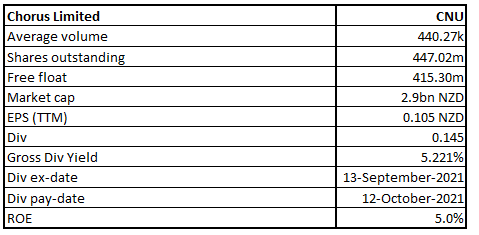
Provider of Fixed Line Communication Infrastructure, Chorus Limited (NZX: CNU) is a New Zealand-based leading telecommunications infrastructure company.
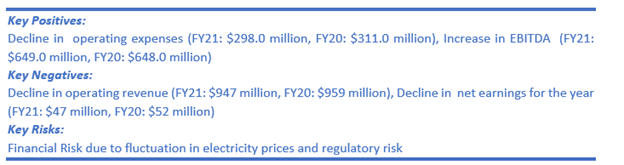
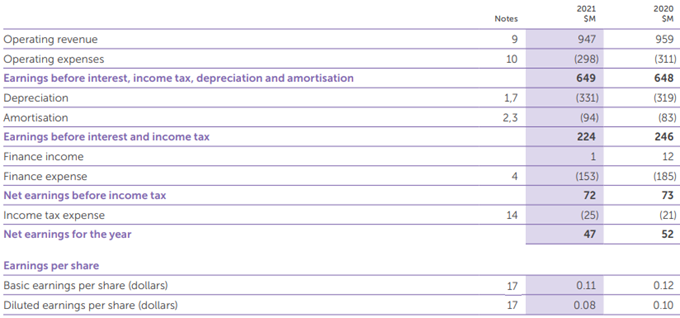
The company’s FY21 topline and bottom line stood at $947.0 million and $47.0 million, moderately lower than the FY20 performance at $959.0 million and $52.0 million, respectively.
Exhibit 1: Historical Operating Performance
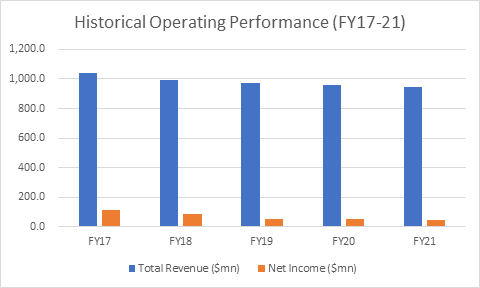
Source: Company Reports, Analysis by Kalkine Group
Results Performance (FY21 ended 30 June 2021)
Exhibit 2: Key Metrics
Key Data (Source: Company Reports)
Top 10 Shareholders: The top 10 shareholders have been highlighted in the pie chart , which together forms around 41.26% of the total shareholding. L1 Capital Pty Ltd. and Unisuper Limited are holding a maximum stake in the company at 9.96% and 6.44%, respectively.
Exhibit 3: Top 10 Shareholders
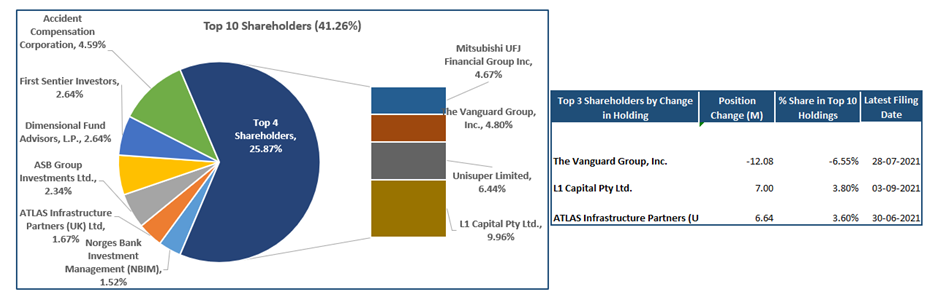
Source: Analysis by Kalkine Group
A Quick Look at Key Metrics: As is obvious from line charts shown below, the company's EBITDA margin improved from 62.7% in FY 2017 to 68.9% in FY 2021 and gross margin improved from 64.3% in FY 2017 to 69.8% in FY 2021, reflecting decent fundamentals. As regard the liquidity profile of the company, the current ratio has improved to 0.44x in FY 2021 from 0.22x in FY 2020.
Exhibit 4: Key Metrics
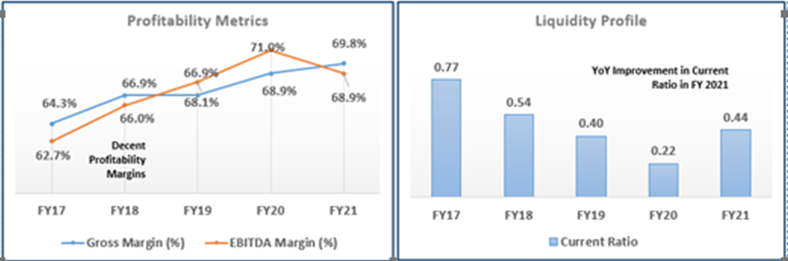
Source: Analysis by Kalkine Group
Outlook:
The company is on track to its target of one million connections by FY22 underpinned by strong demand for reliable and high-capacity broadband. There has been an unprecedented rise in demand for internet data that supports fibre broadband. Further, the Commerce Commission is in the process to finalise the new fibre regulatory model which aims at a smooth transition into the new regime, stronger consumer protections and better information about broadband technologies. This will help CNU to add more connections at higher speeds.
FY22 Guidance:
The company has provided guidance for FY22 whereby it expects EBITDA to be in the range of $640 million to $660 million, gross capex to be in the range of $550 to $590 million and the initial dividend to be around 26 cents per share.
Key Risks:
The company is exposed to a variety of market risks which include the volatility in electricity prices.
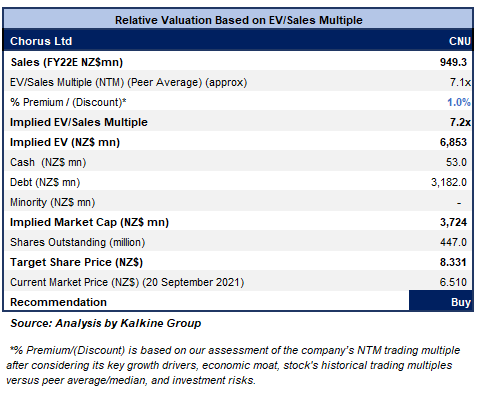
Valuation Methodology: EV/Sales Based Relative Valuation (Illustrative)
Technical Overview:
Chart:
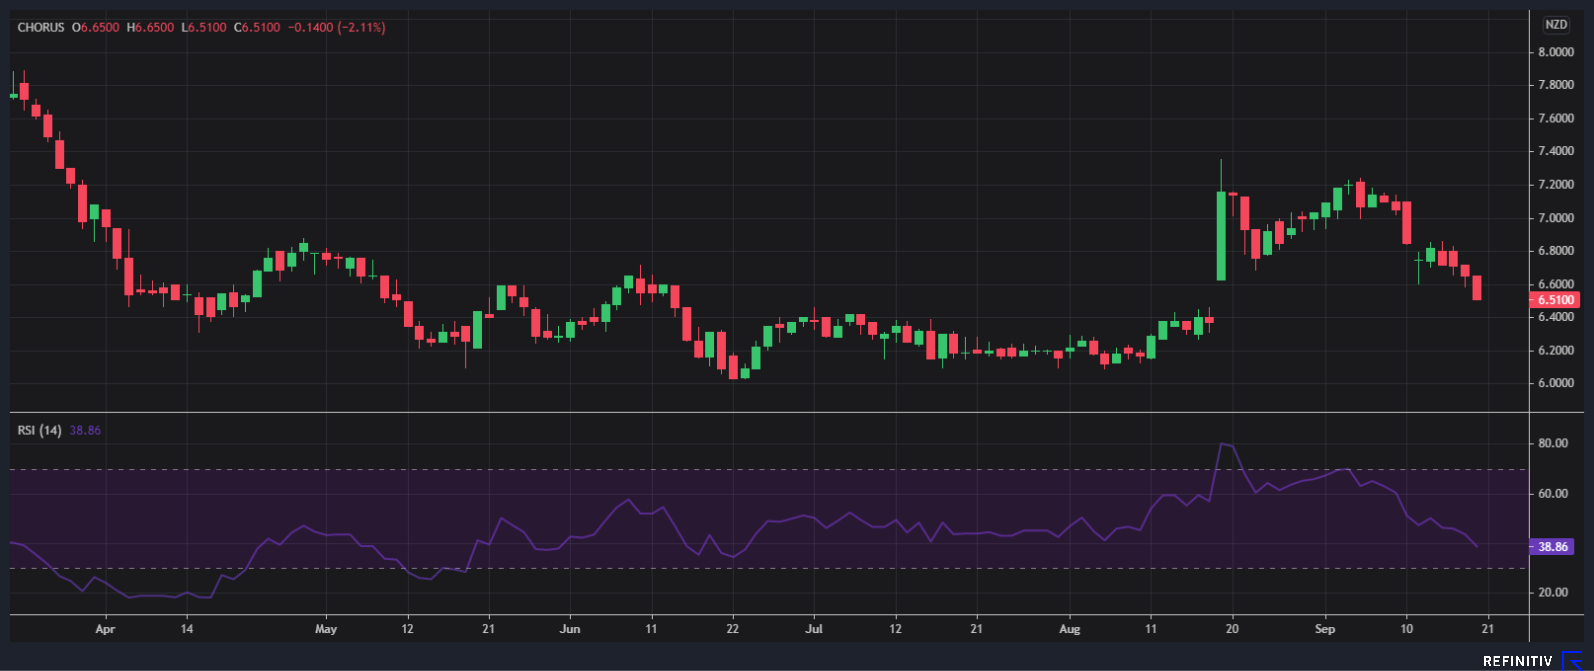
Source: REFINITIV
Note: Purple Color Line Reflects RSI (14-Period)
Stock Recommendation:
Currently, CNU’s stock is trading below the average of 52-week high-low price range band of $9.39-$6.03. The company’s UFB2 rollout continues to track ahead of schedule. Its Fibre passed another 69,000 premises during FY21.
The stock has been valued using an EV/Sales multiple- based illustrative relative valuation method and a target price with the potential of low double-digit (in percentage terms) upside, has been arrived. The company might trade at a slight premium to EV/Sales Multiple (NTM) (Peer Average) considering its diversified product portfolio as well as decent outlook.
Thus, we give a “Buy” rating on the stock at the price of NZ$6.510 per share, down by 2.11% on 20th September 2021.
Note 1: The reference data in this report has been partly sourced from REFINITIV.
Note 2: Investment decisions should be made depending on the investors’ appetite on upside potential, risks, holding duration, and any previous holdings. Investors can consider exiting from the stock if the Target Price mentioned as per the analysis has been achieved and subject to the factors discussed above alongside support levels provided.
Technical Indicators Defined:-
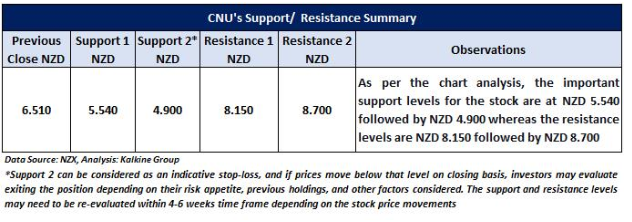
Support: A level where-in the stock prices tend to find support if they are falling, and downtrend may take a pause backed by demand or buying interest.
Resistance: A level where-in the stock prices tend to find resistance when they are rising, and uptrend may take a pause due to profit booking or selling interest.
Stop-loss: It is a level to protect further losses in case of unfavourable movement in the stock prices.
Disclaimer
Kalkine New Zealand Limited is authorised to provide general advice only. The information on this website does not take into account any of your investment objectives, financial situation or needs. Before you make a decision about whether to acquire a financial product, you should obtain the Product Disclosure Statement from the product issuer. You should consider the appropriateness of advice taking into account your own objectives, financial situation and needs and seek independent financial advice before making any financial decisions.
Past performance is not a reliable indicator of future performance.
 Please wait processing your request...