
Company Overview: Chorus Limited (NZX: CNU) is a New Zealand-based leading telecommunications network operating company. The company’s product portfolio includes a broad range of wholesale broadband, data, and voice services across a mix of regulated and commercial products. The company’s strategy is focused on developing the long-term future of its business, growing new revenues, optimizing non-fibre business, and wining core fibre business.
CNU Details
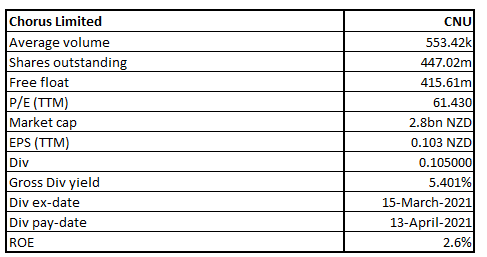
Provider of fixed line communication infrastructure, Chorus Limited (NZX: CNU) is New Zealand’s leading telecommunications infrastructure company. The company has a market capitalisation of ~$2.8 billion as on July 12, 2021.
The company’s product portfolio comprises a broad range of wholesale broadband, data and voice services. Revenues of $959 million in FY20 came lower than $970 million of FY19, reflecting a reduction in total fixed line connections as customers migrated to alternative fibre and wireless networks. However, these line losses were partly offset by an increase in broadband connections over the years along with increases in average revenue per user across its fibre broadband services.
Exhibit 1: Resilient Revenue and Gross Profit Performance (FY16-FY20)
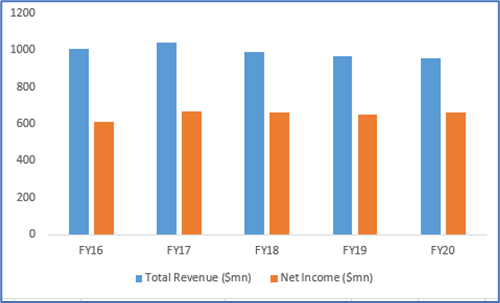
Source: Company Reports, Analysis by Kalkine Group
Results Performance (Half-Year ended 31 December 2020 – H1FY21)
Revenue of the company from continuing operations for the first six months period stood at $473.00 million, a decrease of 2% over first six months of FY20 (pcp). Revenue for the period was impacted by the company’s decision to delay inflation-linked price increase on account of COVID-19 pandemic. Operating expenses reduced slightly to $150 million as a result of its continued focus on controlling discretionary expenditure. EBITDA for the period declined to $323 million as against $332 million of the same period last year, reflecting the continued migration of customers on copper services to alternative networks. Net profit after tax for the period decreased by $7 million to $24 million compared to $31 million of the same period last year.
During the period, fibre remained the dominant category of spend at 85%, with the UFB rollout now 92% complete. Copper related expenditure continues to trend downwards. The Board of Directors declared an interim dividend of 10.5 cents per share (fully imputed).
Top 10 Shareholders: The top 10 shareholders have been highlighted in the pie chart, which together forms around 41.40% of the total shareholding. L1 Capital Pty Ltd. and The Vanguard Group, Inc. are holding a maximum stake in the company at 8.39% and 7.50%, respectively, as provided in the table below:
Exhibit 2: Top 10 Shareholders
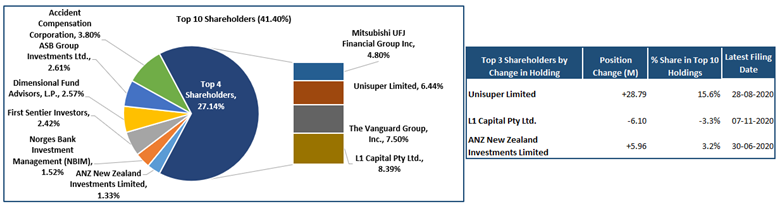
Source: Analysis by Kalkine Group
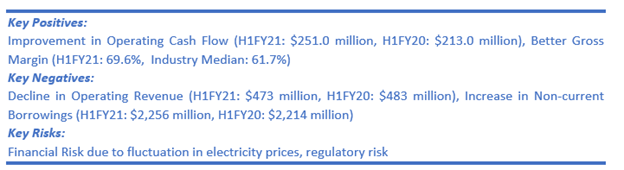
A Quick Look at Key Metrics: The company’s gross margin and net margin for H1FY21 stood at 69.6% and 74.2%, better than the industry median of 61.7% and 30.0%, respectively, implying greater operating efficiencies in terms of managing operating and non-operating costs than its peers. Its cash cycle for H1FY21 stood at 63.3 days, lower than the H1FY20 result of 70.3 days, implying that the company efficiently managed its asset-liability balances. However, the period witnessed a slight decline in the current ratio to 0.62x from 0.86x in the same period last year.
Exhibit 3: Key Metrics
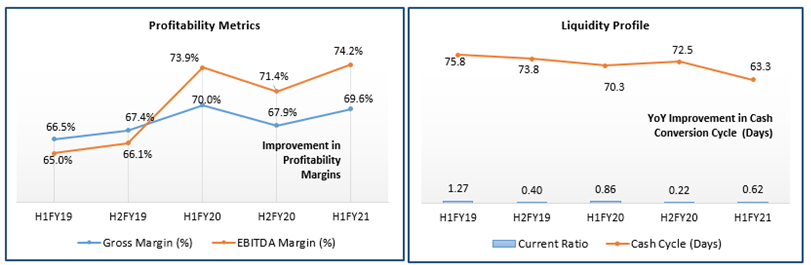
Source: Analysis by Kalkine Group
Recent Update:
The Commerce Commission, on 1 July 2021, released its cost of capital determination for CNU’s price quality path for the first regulatory period from 2022 to 2024. The Commission has determined a mid-point vanilla WACC of 4.72% and a post-tax WACC of 4.52%, reflecting updates to the risk-free rate, cost of debt and cost of equity.
In an earlier update dated 17 May 2021, the company provided that it has communicated its maximum allowable revenue (MAR) submission to the Commerce Commission for the first regulatory period from 2022 to 2024. The MAR submission is based upon the conservative starting Regulated Asset Base (RAB) of $5.5 billion submitted to the Commission in late March, which Chorus advocates strongly should be higher to better reflect the cost of building its UFB network. Chorus’ submission results in an annual revenue range of $720 million to $820 million during the period.
The company has released Q4 FY 2021 overview and stated that copper broadband as well as voice connections witnessed a decline of 44k.However, total broadband connections fell by 1k to 1,180k while the impact of COVID-19 on the net migration constrained broadband growth below the historic rate. Notably, fibre broadband connections witnessed an increase of 29k.
Outlook:
The company has been experiencing a growing demand for fibre broadband connections and continued fibre uptake which is reflected from Q3FY21 connections update from the company whereby fibre broadband connections increased by 29k and fibre uptake across the completed UFB grew from 63% to 64%. In the meanwhile, the company has provided estimates on FY21 EBITDA which has been anticipated towards the lower end of the range of $640 million to $660 million, a marginal decline of 1.2% from FY20. Gross capex estimates has been increased to $670 - $700 million from the prior range of $630 to $670 million. FY21 dividend is expected to be 25 cents per share, subject to no material adverse changes in circumstances or outlook.
Key Risks:
The company is exposed to the risk of cybersecurity besides financial risk. Further, there are certain legacy products where the billing is based on network consumption which cannot be easily linked to a physical end and user connection. This may give rise of dispute with the company’s customers.
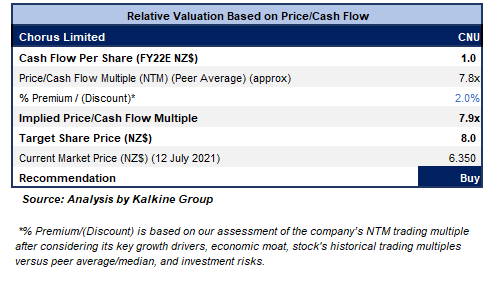
Valuation Methodology: Price/CF Multiple Based Relative Valuation (Illustrative)
Technical Overview:
Weekly Chart –
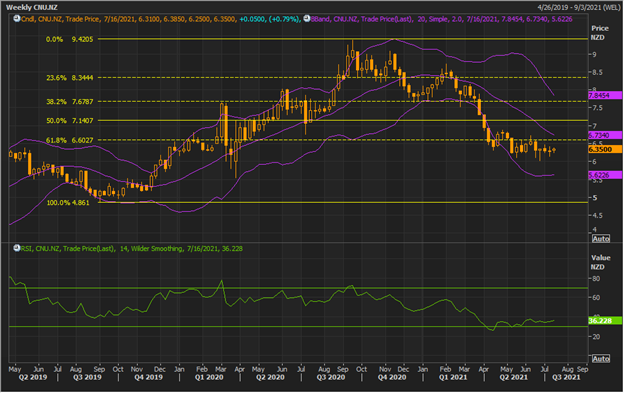
Source: REFINITIV
Note: Purple colour lines are Bollinger Bands® with the upper band suggesting overbought status while the lower band oversold status, and yellow lines are Fibonacci retracement lines which measure price rebound and backtrack. https://www.bollingerbands.com/
The stock has been consolidating in the range of $6.00-$6.60 for a couple of weeks with bias on the upside. On the first trading session of the ongoing week, the stock has given a higher close at $6.35. The technical indicator RSI with a reading around 36 and a curve at the end pointing up, suggests gaining of positive momentum.
Going forward, the stock may have resistance around the 50% retracement level of $7.14 whereas support could be around $6.00.
Stock Recommendation:
The company enjoyed better profitability ratios in terms of higher gross and EBITDA margins than its industry median during the interim period. CNU’s asset-to-equity ratio for the period stood at 6.55x, substantially higher than the industry median of 1.84x.
CNU’s second phase of fibre build, UFB2, continues to track ahead of schedule and is now taking the socio-economic benefits of fibre to many smaller communities. The Commerce Commission’s report has already stated that fibre is “unmatched” against other technologies.
We have applied Price/Cash Flow (P/CF) based relative valuation (on an illustrative basis) and the target price reflects a rise of low double-digit (in % terms). We have applied a slight premium to P/CF Multiple (NTM) (Peer Average) considering better gross margin and operating cash flow.
Considering the aforesaid facts, we give a “Buy” recommendation on the stock at the current market price of NZ$6.350 per share, up by 0.79% on July 12, 2021.
Note 1: The reference data in this report has been partly sourced from REFINITIV.
Note 2: Investment decisions should be made depending on the investors’ appetite on upside potential, risks, holding duration, and any previous holdings. Investors can consider exiting from the stock if the Target Price mentioned as per the analysis has been achieved and subject to the factors discussed above alongside support levels provided.
Technical Indicators Defined: -
Support: A level where-in the stock prices tend to find support if they are falling, and downtrend may take a pause backed by demand or buying interest.
Resistance: A level where-in the stock prices tend to find resistance when they are rising, and uptrend may take a pause due to profit booking or selling interest.
Disclaimer
Kalkine New Zealand Limited is authorised to provide class advice only. The information on this site does not take into account any of your investment objectives, financial situation or needs. Before you make a decision about whether to acquire a financial product, you should obtain the Product Disclosure Statement from the product issuer. You should consider the appropriateness of advice taking into account your own objectives, financial situation and needs and seek independent financial advice before making any financial decisions.
Past performance is not a reliable indicator of future performance.
 Please wait processing your request...