
Company Overview: Telecommunications infrastructure company, Chorus Limited (NZX: CNU) is the largest fixed-line telecommunication network operator which maintains and builds a network made up of local telephone exchanges, cabinets, and copper and fiber cables. Its product portfolio comprises a range of wholesale broadband, data and voice services across a mix of regulated, contracted, and commercial products. Its products include fiber broadband, fiber premium, copper-based voice, data services over copper and copper-based broadband. Its fiber and copper connections provide access to the Chorus fixed lines network to enable connections to the Internet. Its infrastructure includes the physical storage and site-sharing rental services for the co-location of the third party or shared assets. Its field services include services in the field to protect, strengthen, and increase the available network.
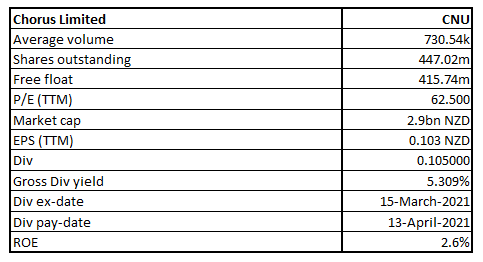
CNU Details
.png)

Provider of Fixed Line Communication Infrastructure, Chorus Limited (NZX: CNU) is New Zealand’s leading telecommunications infrastructure company. The company has a market capitalisation of ~$2.9 billion as on April 19, 2021.
Third Quarter FY21 Overview:
The company’s copper broadband and voice connections declined by 42k, as fixed wireless providers are continuing inertia selling campaigns to their fixed-line customers. In another development, 2degrees has started promoting fixed wireless, while Vodafone introduced a new $40 4G fixed wireless plan with 60GB data.
The total broadband connections declined by 2k to 1,181,000, as COVID-19 impact on net migration and population growth continued to constrain broadband growth. However, the return of students from holidays helped restore some prior period disconnections.
There was an increase in Fibre broadband connections by 29k, supported by an increase in 1 Gbps consumer by 7k and an increase in average monthly data usage on fibre from 460GB in Dec (including upstream traffic) to 491GB.
Exhibit 1: Monthly Data Usage
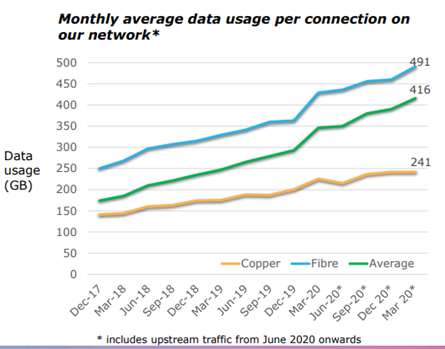
(Source: Company Reports)
Results Performance (Half-Year ended 31 December 2020)
Revenue of the company for the first six months period stood at $473.00 million, a decline of 2% on the previous corresponding period (pcp). The continued migration of customers from legacy copper services to alternative networks particularly in fibre networks area led to a decline in EBITDA for the period to $323 million from $332 million in the same period last year. Net profit for the period stood at $24 million which declined by 23% over the same period last year as a result of an increase in D & A and finance costs.
Fibre uptake increased from 60% to 63%, underpinned by the addition of 62,000 fibre connections in the first six months period supported by strong housing growth fueling increased demand for fibre installations. However, COVID-19’s effect on net migration into the country has softened demand on overall broadband connections.
Exhibit 2: Fixed Line Connections Data
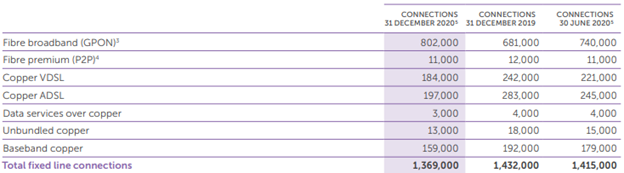
(Source: Company Reports)
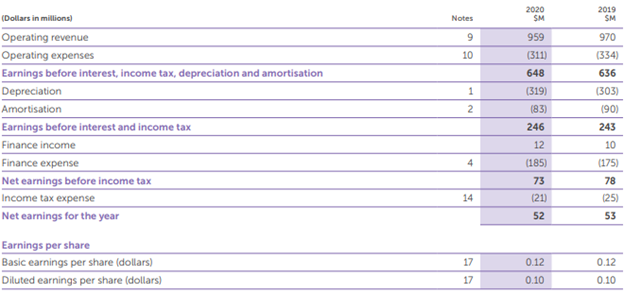
Exhibit 3: Income Statement
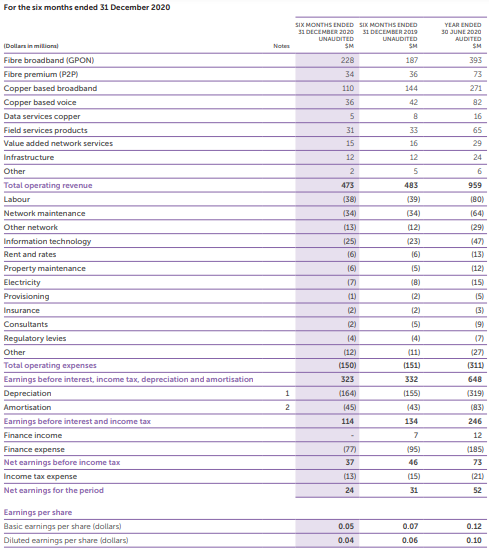
(Source: Company Reports)
Results Performance (Year ended 30 June 2020)
The company reported operating revenue of $959 million for the period compared to $970 million in the previous year. It posted EBITDA of $648 million, an increase of $12 million on the previous year (FY19). Net earnings for the year decreased by $1 million and stood at $52 million. While the FY20 results were impacted by the pandemic, it also demonstrates the positive gains of a continued reduction in network maintenance costs and a decrease in annual regulatory levies. The company decided to pay a dividend of 14 cents per share on 12 October 2020.
Exhibit 4: Key Metrics for FY20
(Source: Company Reports)
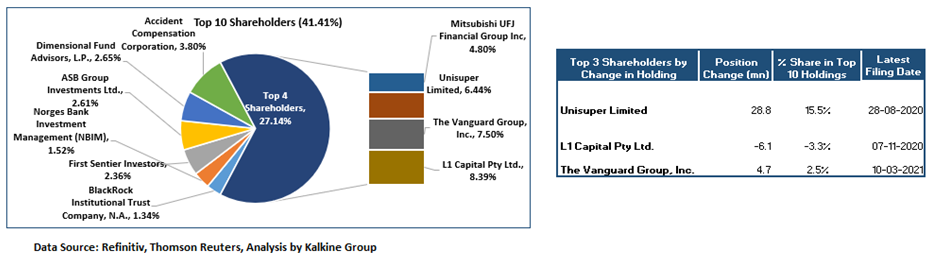
Top 10 Shareholders: The top 10 shareholders have been highlighted in the table, which together forms around 41.41% of the total shareholding. L1 Capital Pty Ltd. and The Vanguard Group, Inc. are holding maximum stake in the company at 8.39% and 7.50%, respectively, as provided in the table below:
Exhibit 5: Top 10 Shareholders
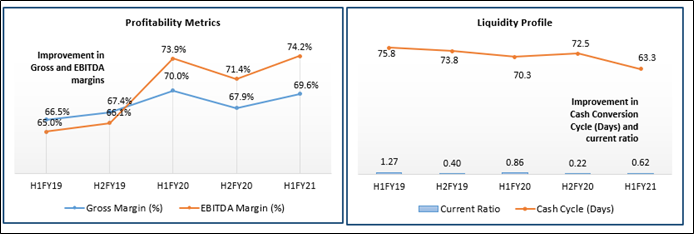
A Quick Look at Key Metrics: The company’s gross margin and EBITDA margin for H1FY21 stood at 69.6% and 74.2%, better than the industry median of 61.7% and 31.0%, respectively, implying better operating efficiency of the company. Its cash cycle for H1FY21 stood at 63.3 days, better than the H1FY20 result of 70.3 days, implying that the company managed its asset-liability balances in an efficient manner.
Exhibit 6: Key Metrics
(Source: Refinitiv (Thomson Reuters)), Analysis by Kalkine Group
Guidance:
The company expects FY21 EBITDA to be in the range of $640 million to $660 million, a marginal decline of 1.2% from FY20. Capital expenditure for FY21 is expected to be in the range of $630 million to $670 million. FY21 dividend is expected to be 25 cents per share, subject to no material adverse changes in circumstances or outlook.
Industry Outlook:
New Zealanders’ desire for data has grown gradually mainly driven by a decline in cost over the past ten years. The decline in the cost has been led by the innovation in technology for both fixed and mobile networks which are further supported by increasing smartphone penetration and the use of new applications. Data usage by fixed as well as mobile connections continued to increase over the year.
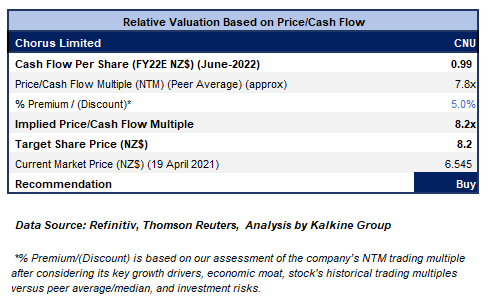
Valuation Methodology: P/CF Based Relative Valuation (Illustrative)
Technical Overview:
Weekly Chart –
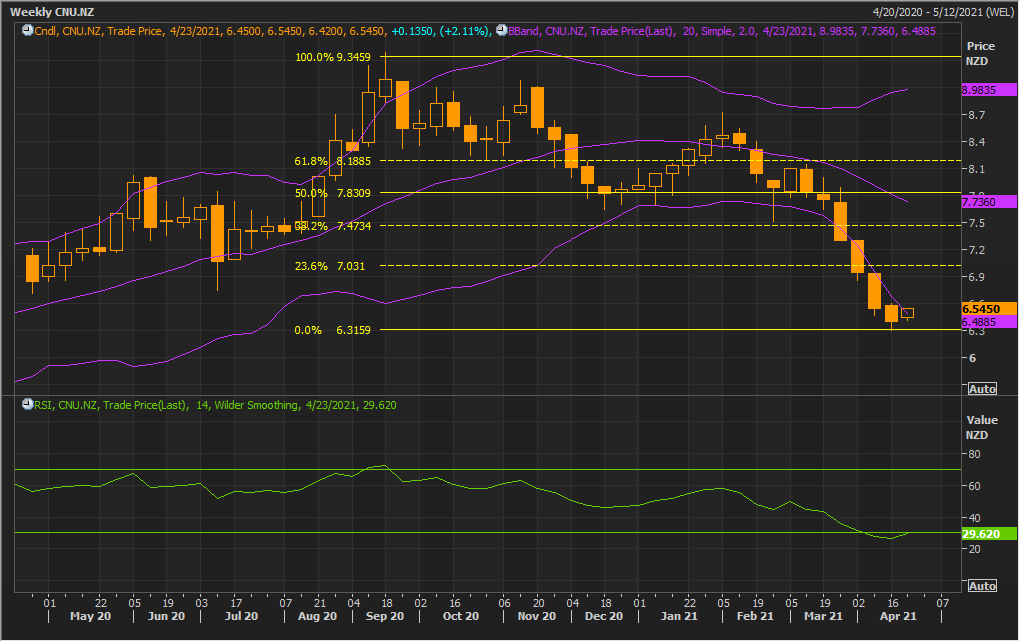
Source: Refinitiv (Thomson Reuters)
Note: Purple colour lines are Bollinger Bands® with the upper band suggesting overbought status while the lower band oversold status, and yellow lines are Fibonacci retracement lines which measure price rebound and backtrack. https://www.bollingerbands.com/
After experiencing a sharper fall over a couple of weeks, the stock has given a stronger close on the first trading session of the ongoing week with the ‘Bullish Harami’ pattern formed on the chart which reflects on the potential bullish reversal of the trend. The technical indicator RSI with a reading around 30 suggests that the stock is in the oversold zone thereby indicating a limited downside for the stock if any.
Going forward, the stock may have resistance around the 23.6% retracement level of $7.03 whereas support could be around the previous low of $6.31.
Key Risks:
The company is exposed to risks related to COVID-19 as its effect on net migration into the country might impact the demand on the overall broadband connections. Also, the impact can also be felt on fibre uptake.
Stock Recommendation:
The company has a long-term credit rating of BBB/stable outlook from Standard & Poor’s and Baa2/stable from Moody’s Investors Service as on 31 December 2020 which highlights the operating and financial soundness of the company.
The recent Commerce Commission’s report describing fibre “unmatched” against other technologies gives further credibility to the use of fibre. The company has initiated the second phase of fibre build to capitalize on burgeoning demand for fibre connections. It is also gearing itself to take advantage of the new market of multi-gigabit fibre services. Besides, the company is progressing well on optimising its business and reducing costs, together with the broadband connection performance.
Considering the aforesaid facts, we have valued the stock using Price to Cash Flow multiple-based valuation (on an illustrative basis) and have arrived at the target price with the potential of low double-digit (in % terms) upside. We have applied a slight premium to P/CF Multiple (NTM) (Peer Average) considering improvement in operating cash flow, increased demand for fibre installation and decent liquidity position which could help the company in achieving long-term growth objectives.
Hence, we give a “Buy” recommendation on the stock at the current market price of NZ$6.545 per share, up by 2.11% on April 19, 2021.
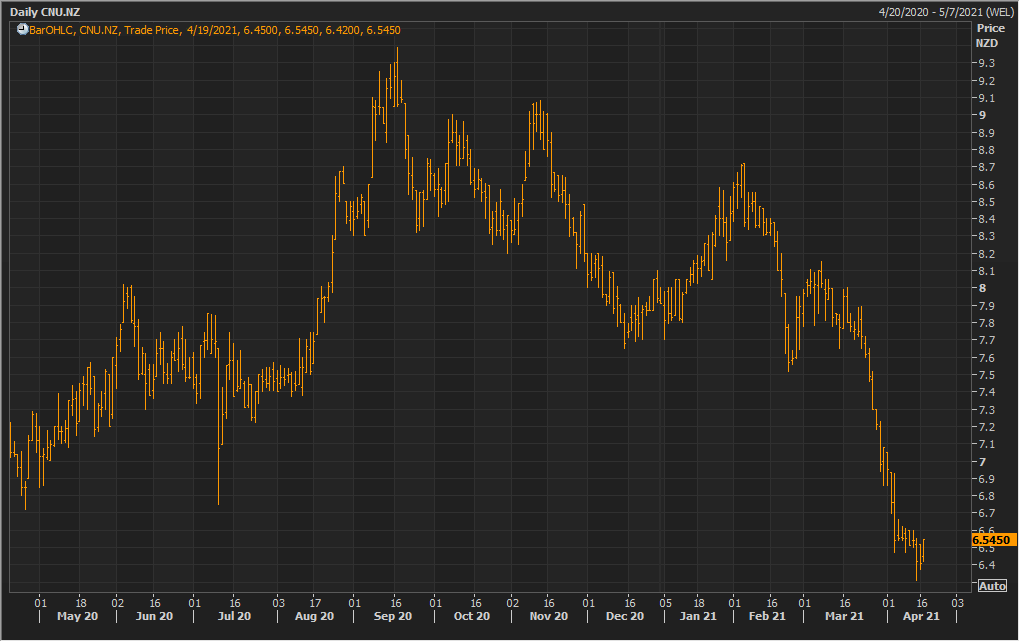
CNU Daily Technical Chart (Source: Refinitiv (Thomson Reuters))
Disclaimer
Kalkine New Zealand Limited is authorised to provide class advice only. The information on this site does not take into account any of your investment objectives, financial situation or needs. Before you make a decision about whether to acquire a financial product, you should obtain the Product Disclosure Statement from the product issuer. You should consider the appropriateness of advice taking into account your own objectives, financial situation and needs and seek independent financial advice before making any financial decisions.
Past performance is not a reliable indicator of future performance.
 Please wait processing your request...