
Company Overview: Telecommunications infrastructure company, Chorus Limited (NZX: CNU) is the largest fixed-line telecommunications network operator in New Zealand. It maintains and builds a network made up of local telephone exchanges, cabinets, and copper and fiber cables. Its product portfolio comprises a range of wholesale broadband, data, and voice services across a mix of regulated, contracted, and commercial products. Its products include fiber broadband, fiber premium, copper-based voice, data services over copper and copper-based broadband. Its fiber and copper connections provide access to the Chorus fixed lines network to enable internet connections. Its infrastructure includes the physical storage and site-sharing rental services for the co-location of the third party or shared assets. Its field services include services in the field to protect, strengthen, and increase the available network.
CNU Details
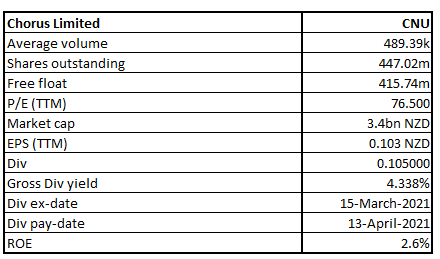
Provider of Fixed Line Communication Infrastructure, Chorus Limited (NZX: CNU) is New Zealand’s leading telecommunications infrastructure company. The company has a market capitalisation of ~$3.4 billion as on March 15, 2021.
Results Performance (Half-Year ended 31 December 2020)
The company reported operating revenue of $473 million for the interim period, a decline of 2% on the previous corresponding period (pcp). EBITDA for the period stood at $323 million, as compared to $332 million in the pcp, mainly due to the continued migration of customers from legacy copper services to alternative networks, particularly in non-Chorus fibre networks areas. Operating expenses for the period stood at $150 million, as compared to $151 million in the pcp reflecting ongoing tight control of discretionary expenditure. Depreciation and amortization stood at $209 million, as compared to $198 million in the pcp due to an increase in network asset base and reduction in finance costs. Net profit for the period stood at $24.00 million, a decline of 23% on pcp. Net tangible assets per Quoted Equity Security for the period stood at $1.41, as compared to $1.67 in the pcp.
The period witnessed a surge in the Fibre connections by 62,000 to 813,000. The Board of Directors announced an interim dividend of 10.5 cents per share (fully imputed) with a payment date on 13 April 2021. A dividend reinvestment plan would apply for the interim dividend at a discount rate of 2%.
Exhibit 1: Income Statement
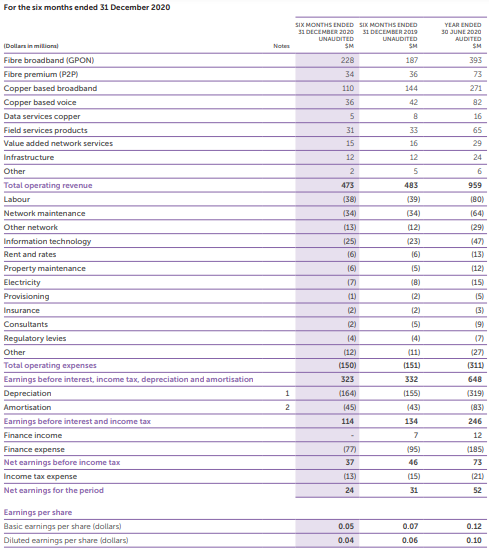
(Source: Company Reports)
Operational Performance (Second Quarter ended 31 December 2020)
During Q2FY21, the company reported fibre uptake increasing to 63% with UFB rollout completing by 92%. During the period, fibre broadband connections increased by 29K, copper broadband and voice connections declined by 50K, total broadband connections declined by 10K to 1,183,000 and total fixed-line connections declined by 21K to 1,369,000.
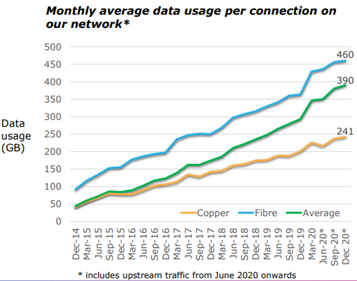
Exhibit 2: Monthly average data usage on fibre
(Source: Company Reports)
Monthly average data usage per connection on the company’s network grew to 390GB in December 2020, up from 380GB in September 2020. This includes connections on fibre of 460GB in December against 456GB in September, and connection on copper of 241GB in December against 236GB in September.
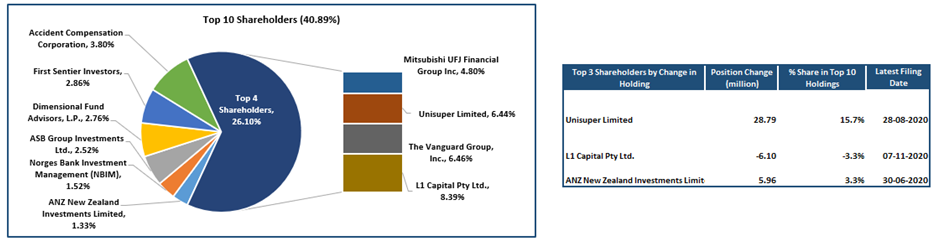
Top 10 Shareholders: The top 10 shareholders have been provided in the table, which together forms around 40.89% of the total shareholding. L1 Capital Pty Ltd. and The Vanguard Group, Inc. are holding a maximum stake in the company at 8.39% and 6.46%, respectively, as has been shown in the table below:
Exhibit 3: Top 10 Shareholders
(Source: Refinitiv (Thomson Reuters)), Analysis by Kalkine Group
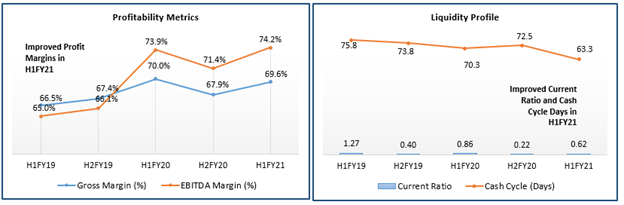
A Quick Look at Key Metrics: The company’s gross margin and EBITDA margin for H1FY21 stood at 69.6% and 74.2%, better than the industry median of 62.6% and 32.6%, respectively, implying greater efficiency in managing costs for the company. Its cash cycle for H1FY21 stood at 63.3 days, better than the H1FY20 result of 70.3 days, implying that the company efficiently managed its asset-liability balances.
Exhibit 4: Key Metrics
(Source: Refinitiv (Thomson Reuters)), Analysis by Kalkine Group
Industry Outlook:
New Zealanders’ desire for data has grown gradually partially driven by a decline in cost over the past ten years. The decline in the cost has been led by the innovation in technology for both fixed and mobile networks further supported by increasing smartphone penetration and the use of new applications. Data usage by fixed-line as well as mobile connections continued to increase over the year. There has been increased demand for fibre connections while broadband connections have dipped as a result of softer net migration into the country.
Company Outlook:
As per the guidance provided by the company, EBITDA for FY21 is expected to be in the range of $640 million to $660 million whereas Capex for the said financial year is expected to be in the range of $670 million to $700 million. Dividend for FY21 has been expected to be 25 cents per share which is subject to no material adverse changes in circumstances or outlook.
The trend of increased fibre connections is continuing, more so, driven by the strong housing growth. As per the recent Commerce Commission’s report, the fibre technology seems to be unmatched against any other technology, which further lend credentials to the use of fibre . Considering this, the management of the company has initiated the second phase of fibre build-out. While doing so, CNU is ensuring its copper network remains well-maintained to deliver the best possible voice and broadband services. Furthermore, the company is gearing up to take advantage of the new market created by the availability of multi-gigabit fibre services.
Valuation Methodology: P/CF Based Relative Valuation (Illustrative)
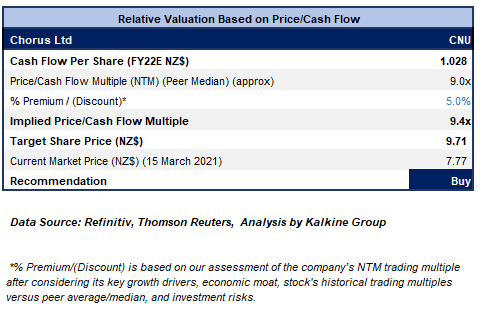
We have applied P/CF based relative valuation (on an illustrative basis) and the target price reflects a rise of low double-digit (in % terms). We have applied a slight premium to Price/Cash Flow Multiple (NTM) (Peer Median) considering the company's focus towards optimizing the non-fibre assets as well as vision for developing the long-term future of the business.
Technical Overview:
Weekly Chart –
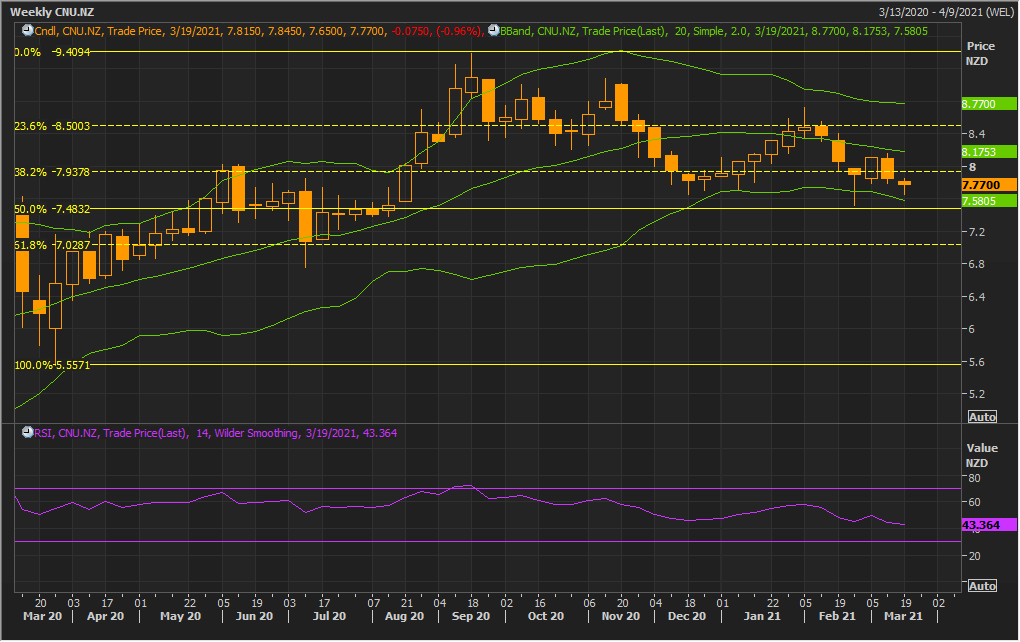
Source: Refinitiv (Thomson Reuters)
Note: Green colour lines are Bollinger Bands® with the upper band suggesting overbought status while the lower band oversold status, and yellow lines are Fibonacci retracement lines which measure price rebound and backtrack. https://www.bollingerbands.com/
After the previous week’s sell-off, the stock has given a weaker close but with a ‘Hammer’ formed on the chart which indicates at potential bullish reversal for the stock. The technical indicator RSI with a reading around 43 suggests neutral momentum for the stock.
Going forward, the stock may have resistance around 20 periods SMA of $8.17 whereas support could be around the lower Bollinger band of $7.58.
Stock Recommendation:
The company is progressing on optimizing its business and reducing costs, together with the broadband connection performance. The stock has given a return of ~5.28% and ~20.46% over the nine months and one-year period, respectively.
Considering the aforesaid facts, we have valued the stock using Price to Cash Flow multiple-based valuation (on an illustrative basis) and the target price reflects a rise of low double-digit (in % terms).
Hence, we give a “Buy” recommendation on the stock at the current market price of NZ$7.770 per share, up by 0.39% on March 15, 2021.
.png)
CNU Daily Technical Chart (Source: Refinitiv (Thomson Reuters))
Disclaimer
Kalkine New Zealand Limited is authorised to provide class advice only. The information on this site does not take into account any of your investment objectives, financial situation or needs. Before you make a decision about whether to acquire a financial product, you should obtain the Product Disclosure Statement from the product issuer. You should consider the appropriateness of advice taking into account your own objectives, financial situation and needs and seek independent financial advice before making any financial decisions.
Past performance is not a reliable indicator of future performance.
 Please wait processing your request...