
Company Overview :
NZ Windfarms Ltd (NZX: NWF) is the long-term specialist wind farm owner and operator. Genesis Energy Limited (NZX: GNE) is a New Zealand-owned energy company which fosters robust links with the customers as well as community stakeholders. Kalkine’s Sector Report covers the Key Financial Metrics, Risks, Outlook, Technical Analysis along with the Valuation, Target Price, and Recommendation on the stock.
1. Sector Landscape and Outlook
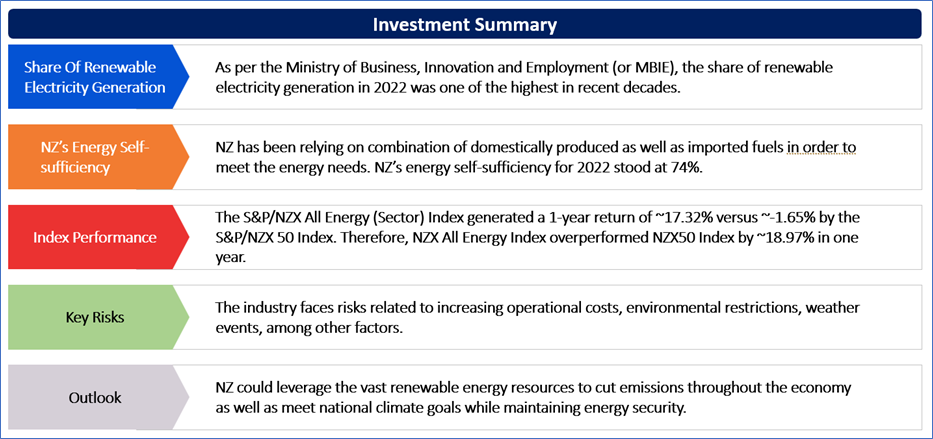
As per the Ministry of Business, Innovation and Employment (or MBIE), the share of renewable electricity generation in 2022 was one of the highest in recent decades. This was because autumn and winter rain ensured hydro inflows remained at the elevated levels. Renewable sources was able to generate 95% of electricity in Q4 FY 2022. This was the highest quarterly share from renewables since 1980. Overall, 87% of electricity generated in 2022 was from renewable sources. Hydroelectric generation made up for 60% of all electricity for 2022 (reflecting a rise of 4.4 percentage points on 2021) and coal-fired electricity made up for ~2.9% (reflecting a fall of 4.1 percentage points on 2021). Resultantly, the amount of coal imported for the year was 61% lower as compared to 2021, as electricity generation is one of the important uses of imported coal.
NZ has been relying on combination of domestically produced as well as imported fuels in order to meet the energy needs. NZ’s energy self-sufficiency for 2022 stood at 74%. This means that the country was able to meet 74% of its energy supply requirements for the year with the help of domestic production. The main contributors to NZ’s energy self-sufficiency are coal and oil. These are the 2 fuels which NZ trades internationally. NZ has historically been a net exporter of coal and the net importer of oil. This means that the coal self-sufficiency tends to be over 100% and the oil self-sufficiency tends to be lesser than 100 per cent. Notably, the coal self-sufficiency rose to 154% in 2022 because of the decrease in the amount imported, but oil self-sufficiency decreased to 12%.
Energy Supply From Renewables
As per the release dated 17th August 2023 by MBIE, NZ’s wider renewable capacity continued to grow in 2022, with the new records for renewable energy consumption. Notably, the energy consumed from renewable sources made up ~30% of the total final consumption in 2022, which was the highest value ever recorded. Notably, the energy supply from renewables touched 44% in 2022, building off last year’s record high of 40.8%. This was highest since reporting started in 1990.
Three years after the pandemic started, NZ’s energy consumption remained 6.5% below pre-COVID-19 levels. The energy consumption stood at 543 petajoules (PJ) as compared to the peak of 581 PJ in 2019. The consumption by sector also changed marginally, with energy use in the agriculture, forestry as well as fishing sector declining by 8.4% (or 2.6 PJ) as compared to 2021.
Exhibit 1: Trend in Renewable Share (%)-Four-Quarter Moving Average
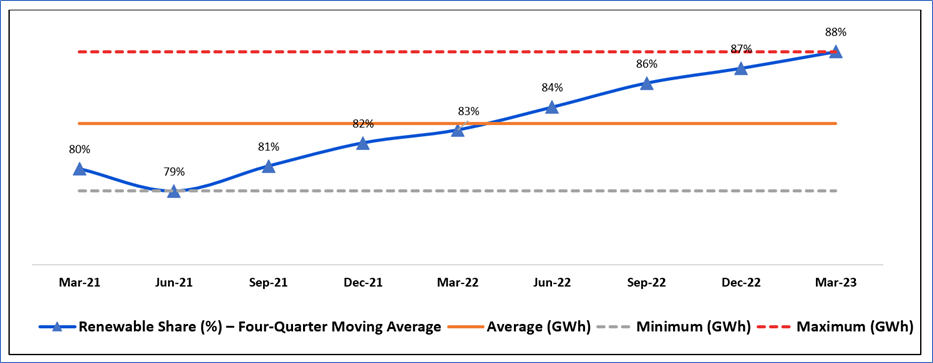
Data Source: This work is owned by the Ministry of Business, Innovation and Employment on behalf of the Crown which are licensed for reuse under the Creative Commons Attribution 4.0 International Licence; Chart Created by Kalkine Group
The Government’s Focus on Energy
NZ’s primary industry sector has been making huge strides in reducing reliance on fossil fuels as well as cutting carbon emissions in partnership with Government. There has been an announcement to support for 17 industrial energy users to help them stop utilising fossil fuels faster through the Government Investment in Decarbonising Industry (or GIDI) Fund.
The country’s largest food processors and manufacturers, like Alliance and Open Country Dairy, are making further commitments on multiple, large decarbonisation projects. There has been a real momentum building in pushing fossil fuels out of the energy system as well as reducing emissions via renewables and energy efficiency.
Exhibit 2: Trend in Major Energy Contributor to Net Generation in New Zealand

Data Source: This work is owned by the Ministry of Business, Innovation and Employment on behalf of the Crown which are licensed for reuse under the Creative Commons Attribution 4.0 International Licence; Chart Created by Kalkine Group
Index Performance:
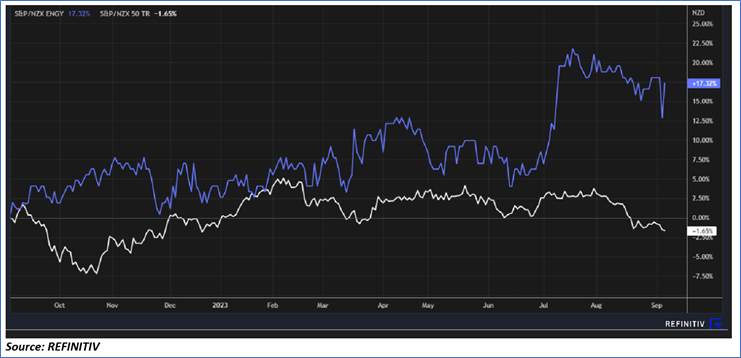
The S&P/NZX All Energy (Sector) Index generated a 1-year return of ~17.32% versus ~-1.65% by the S&P/NZX 50 Index. Therefore, NZX All Energy Index overperformed NZX50 Index by ~18.97% in one year.
Exhibit 3: S&P/NZX All Energy (Sector) vs S&P/NZX50 Index
Key Risks and Challenges:
The government as well as private players are together in supporting low-carbon electricity systems, a complex collaboration of multiple technologies with strategic functions to maximize output.
According to International Energy Agency, the critical challenge is decarbonising transport as well as industrial sectors with the help of clean electricity and supporting deployments towards technologies in order to achieve emissions cuts cost effectively. The global energy crisis was triggered by the Russia’s invasion of Ukraine and this caused profound as well as long-lasting changes.
The biggest shocks were felt in the markets for natural gas, coal as well as electricity – with significant disruption in oil markets as well, necessitating 2 oil stock releases of unparalleled scale by IEA member countries in order to avoid even more severe disruptions.
Exhibit 4. Key Risks in Utilities Sector:
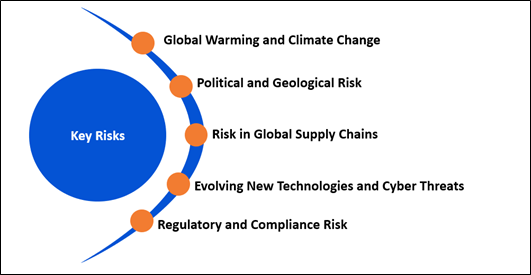
Source:- Analysis: Kalkine Group
Outlook:
NZ could leverage the vast renewable energy resources to cut emissions throughout the economy as well as meet national climate goals while maintaining energy security, as per the report by the International Energy Agency. Since agency’s last review in 2017, the country has been able to set more ambitious targets for reduction of greenhouse gas emissions, including bringing them down by 50% from 2005 levels by 2030 – as well as to net zero by 2050. NZ has taken steps in order to address the climate change, including implementing emissions budgets as well as comprehensive emissions reduction plan.
As per International Energy Agency, the country is required to focus towards next phase of the energy transition through leveraging the clean electricity strengths to decarbonise transport and industry.
NZ’s updated climate target under the Paris Agreement is to reduce net GHG emissions by 50% from gross 2005 levels by 2030. Notably, the most recent domestic legislation is the Climate Change Response (Zero Carbon) Amendment Act 2019. This sets the net zero GHG emissions target (exempting biogenic methane, mostly from cattle) by 2050. It also includes the target to reduce biogenic methane emissions by 10% from 2017 levels by 2030 and by 25-47% by 2050.
Apart from the sector-specific factors, an analysis on two NZX-listed companies is provided. This report covers their insights, outlook, performance and potential as expected to be delivered in the near to medium term.
1) NZ Windfarms Limited (Recommendation: Speculative Buy, Potential Upside: Low Double-Digit) (M-Cap: NZD 34.5 million, Annual Dividend Yield (TTM)1: 2.5%)
Business Description:
NZ Windfarms Ltd (NZX: NWF) is the long-term specialist wind farm owner and operator.
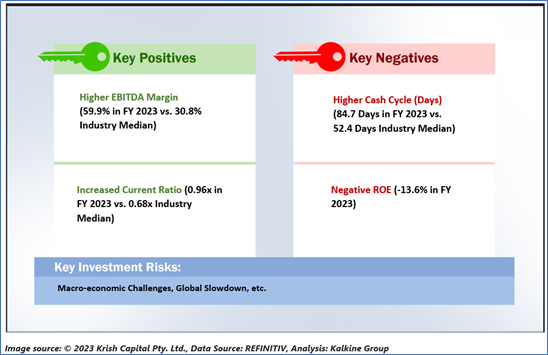
Outlook:
On the basis of the forecasts for FY 2024, the company is expecting its EBITDAF to be between $3.0 Mn - $4.5 Mn. The FY 2024 EBITDAF guidance range is based on the annual production level of 106 GWh, which is a higher confidence estimate on the basis of a blend of annual averages as well as an independent determination of P75 Annual Energy Production (AEP). The company is 67% hedged for FY 2024 and 41% hedged for FY 2025.
Technical Overview:
Daily Price Chart
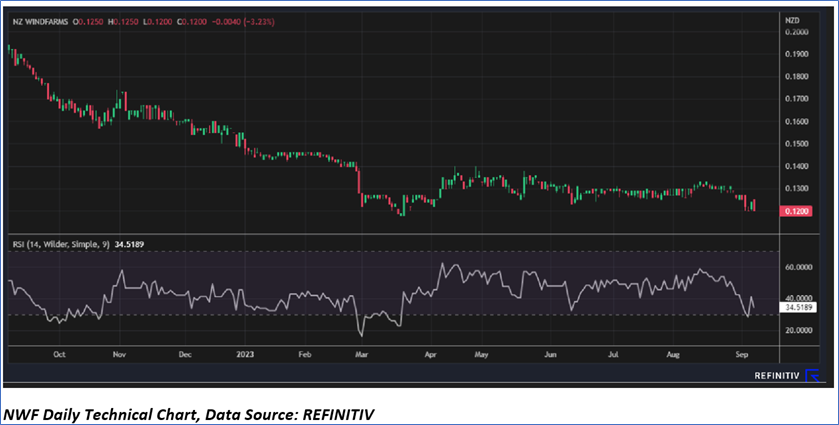
Technical Commentary:
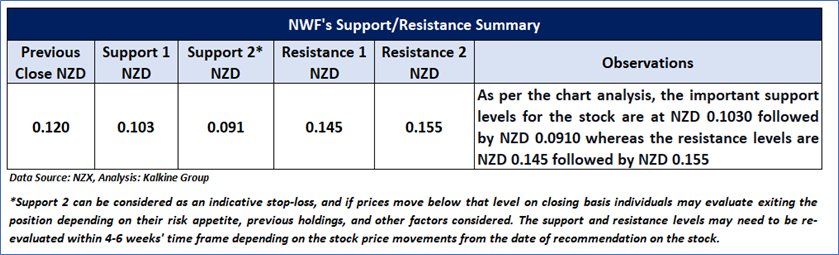
On the daily chart, NWF prices are trading above the horizontal trendline support level. Moreover, the momentum oscillator RSI (14-period) is showing a reading of ~34.5189 level. However, the prices are trading below the trend-following indicators 21-period SMA, which may act as a resistance zone. An important support level for the stock is placed at NZD 0.103 while the key resistance level is placed at NZD 0.145.
Stock Recommendation
Considering the facts above, a ‘Speculative Buy’ recommendation on the stock has been provided at the closing market price of NZD 0.120 per share, down by 3.23% as on 7 September 2023.
2) Genesis Energy Limited (Recommendation: Buy, Potential Upside: Low Double-Digit) (M-Cap: NZD 2.63 billion, Annual Dividend Yield (TTM)1: 9.67%)
Business Description:
Genesis Energy Limited (NZX: GNE) is a New Zealand-owned energy company which fosters robust links with the customers as well as community stakeholders.
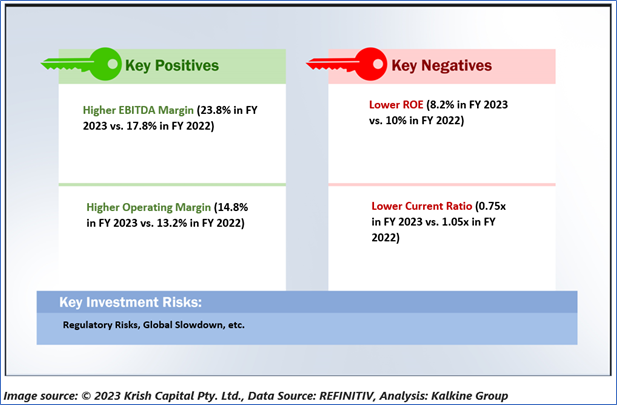
Outlook:
Notably, GNE is expecting FY 2024 EBITDAF of ~$430 Mn subject to the hydrological conditions, gas availability as well as any material adverse events or unforeseeable circumstances. The capital expenditure in FY 2024 is expected to be ~$165 Mn.
Technical Overview:
Daily Price Chart
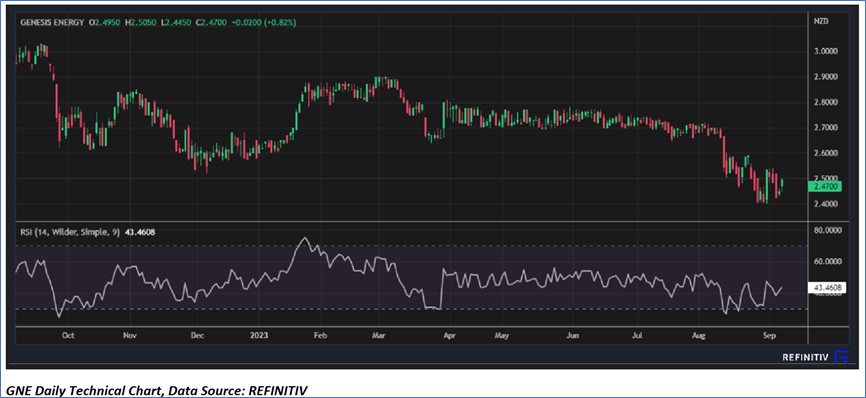
Technical Commentary
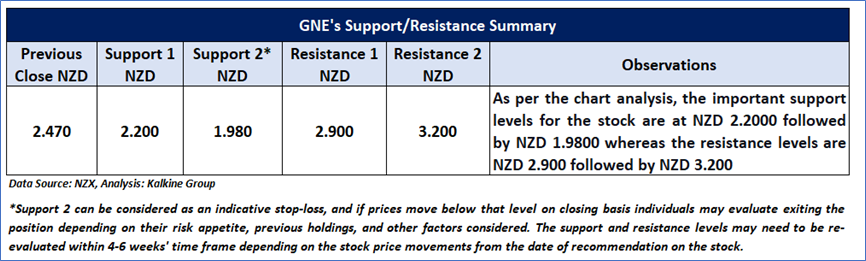
On the daily chart, GNE prices are trading above the falling trendline support zone. Moreover, the momentum oscillator RSI (14-period) is showing a reading of ~43.4608 level. However, the prices are trading below trend-following indicator 21-period SMA, which may act as a resistance level. An important support level for the stock is placed at NZD 2.2 while the key resistance level is placed at NZD 2.90.
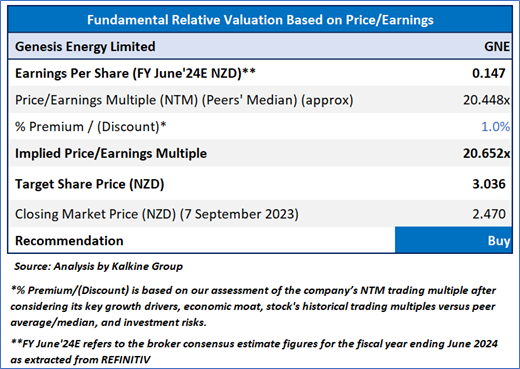
Fundamental Valuation:
Price/EPS Based Relative Valuation
Stock Recommendation
Considering the aforementioned factors, a ‘Buy’ rating is given on the stock at the closing market price of NZD 2.470 per share, up by 0.82% as of 7 September 2023.
Markets are trading in a highly volatile zone currently due to certain macro-economic issues and geopolitical tensions prevailing. Therefore, it is prudent to follow a cautious approach while investing.
Note 1: Past performance is neither an indicator nor a guarantee of future performance.
Note 2: The reference date for all price data, currency, technical indicators, support, and resistance levels is 7 September 2023. The reference data in this report has been partly sourced from REFINITIV.
Note 3: Investment decisions should be made depending on an individual's appetite for upside potential, risks, holding duration, and any previous holdings. An 'Exit' from the stock can be considered if the Target Price mentioned as per the Valuation and or the technical levels provided has been achieved and is subject to the factors discussed above.
Note 4: Annual Dividend Yield is on a Trailing Twelve Month (TTM1) basis and are subject to change based on factors such as company performance, stock price changes, etc.
Technical Indicators Defined: -
Support: A level at which the stock prices tend to find support if they are falling, and a downtrend may take a pause backed by demand or buying interest. Support 1 refers to the nearby support level for the stock and if the price breaches the level, then Support 2 may act as the crucial support level for the stock.
Resistance: A level at which the stock prices tend to find resistance when they are rising, and an uptrend may take a pause due to profit booking or selling interest. Resistance 1 refers to the nearby resistance level for the stock and if the price surpasses the level, then Resistance 2 may act as the crucial resistance level for the stock.
Stop-loss: It is a level to protect further losses in case of unfavourable movement in the stock prices.
Disclaimer
Kalkine New Zealand Limited is a Financial Advice Provider (“FAP”) and is authorised by a Class 1 Financial Advice Provider Licence issued by Financial Markets Authority (“FMA”) to provide financial advice. Kalkine provides only general financial advice through its research reports following a person becoming a member. The reports contain buy/sell/hold and other recommendations in relation to equity financial products. The recommendations and opinions [on this website] / [in this report] do not take into account any of your investment objectives, financial situation or needs. Before you make a decision about whether to acquire a financial product, you should obtain the Product Disclosure Statement from the product issuer. You should consider the appropriateness of advice taking into account your own objectives, financial situation and needs and seek independent financial advice before making any financial decisions. If you act on the advice in the research reports, you may have to pay fees, expenses or other amounts (but not to Kalkine). Further information about the complaints and dispute resolution process, as well as information about Kalkine’s duties are available on Kalkine’s website. Please read our Financial Advice Provider (FAP) disclosure statement and Complaints Handling Guide, which are available on the website.
Past performance is not a reliable indicator of future performance.
 Please wait processing your request...