
Company Overview: Steel & Tube Holdings Limited (NZX: STU) is one of NZ's leading providers of steel solutions, enabling access to the widest range of steel products in the market, through the nationwide network of distribution centres. Skellerup Holdings Limited (NZX: SKL) designs, manufactures as well as sells engineered polymer products and vacuum systems for customers in dairy rubberware, water and related infrastructure, roofing, etc. Kalkine’s Sector Report covers the Key Financial Metrics, Risks, Outlook, Technical Analysis along with the Valuation, Target Price, and Recommendation on the stock.
I. Sector Landscape and Outlook
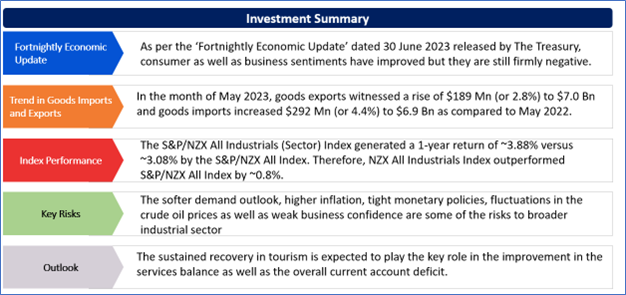
As per the ‘Fortnightly Economic Update’ dated 30 June 2023 released by The Treasury, consumer as well as business sentiments have improved but they are still firmly negative. However, merchandise trade in May led to the slowing in deterioration of the annual trade deficit. The global central banks are expected to continue tightening even though there are signs of slowing activity.
Nonetheless, tight labour markets are continuing to help services demand, and further policy tightening might be required. In contrast, slower growth in China has prompted the authorities to loosen up the monetary policy as well as further easing is anticipated. Business confidence has witnessed improvement in the month of June to -18 from -31 in May. This was the highest reading since November 2021 shortly after the start of the Reserve Bank’s monetary policy tightening. Firms’ own Activity Outlook witnessed slight improvement in June, but finally touched positive territory having been below zero for more than a year.
NZ’s annual trade deficit witnessed a rise to $17.1 Bn in May, but the rate of increase is slowing. This is because the monthly balance has been narrowing. Monthly export values encountered 0.6% rise on the seasonally adjusted basis (because of dairy, meat, and fruit exports), while import values declined 6.2% because of ongoing volatility in the petrol imports.
Overseas Merchandise Trade- May 2023
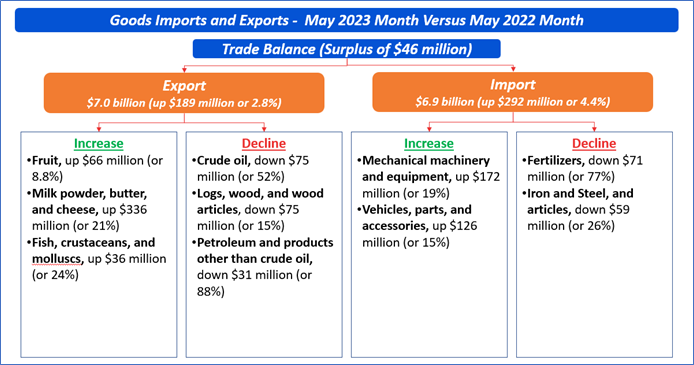
In the month of May 2023, goods exports witnessed a rise of $189 Mn (or 2.8%) to $7.0 Bn and goods imports increased $292 Mn (or 4.4%) to $6.9 Bn as compared to May 2022. Therefore, the monthly trade balance was the surplus of $46 Mn. Milk powder witnessed a rise of $156 million (18%) in value to $1.0 billion and the quantity exported witnessed a rise of 51%. The average unit price declined by 21%.
Cheese increased $109 Mn (or 60%) in value to $291 Mn as well as the quantity exported increased 54%. The average price per kilogram increased 4.1%.
For the year ended May 2023, annual goods exports amounted to $72.8 Bn, reflecting the rise of $5.5 Bn and annual goods imports stood at $89.9 Bn, up $13.2 billion as compared to the year ended May 2022.
Exhibit 1: Goods Imports and Exports - May 2023 Month Versus May 2022 Month
Data Source: This work is based on/includes Stats NZ’s data which are licensed by Stats NZ for reuse under the Creative Commons Attribution 4.0 International Licence; Chart Created by Kalkine Group
Imports- Analysing The Trend
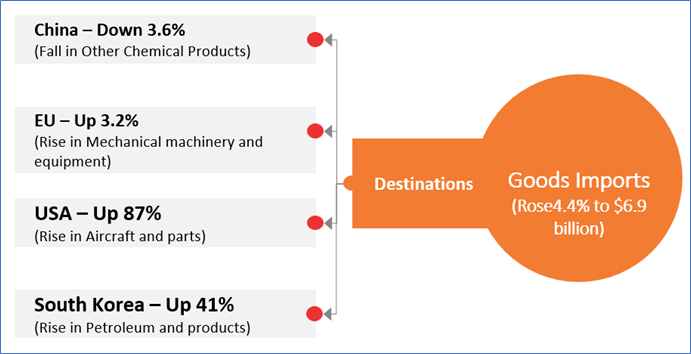
As mentioned earlier, goods imports increased by $292 Mn (or 4.4%) to $6.9 Bn in the month of May 2023 as compared to May 2022. Aircraft and parts witnessed a rise of $279 Mn (or 748%) to $317 Mn. Notably, imports of aircraft and parts tend to fluctuate month to month on the basis of individual large movements.
Mechanical machinery and equipment increased $172 Mn (or 19%) to $1.1 Bn. Turbo-jets, turbo-propellers as well as other gas turbines led this increase, up $187 Mn.
Talking about China, the total imports were down $52 Mn (or 3.6%). The top 3 increases were: vehicles, parts, and accessories (up $78 million); optical, medical, and measuring equipment (up $3.6 million); as well as ships, boats, and floating structures (up $2.9 million).
With respect to USA, total imports rose $435 Mn (or 87%). The top three rises were: aircraft and parts (up $284 million); mechanical machinery and equipment (up $95 million); and electrical machinery and equipment (up $28 million).
Exhibit: 2 Goods Imports- Destinations
Data Source: This work is based on/includes Stats NZ’s data which are licensed by Stats NZ for reuse under the Creative Commons Attribution 4.0 International Licence; Chart Created by Kalkine Group
Index Performance:
The S&P/NZX All Industrials (Sector) Index generated a 1-year return of ~3.88% versus ~3.08% by the S&P/NZX All Index. Therefore, NZX All Industrials Index outperformed S&P/NZX All Index by ~0.8%.
Exhibit 3: S&P/NZX All Industrials (Sector) vs S&P/NZX50 Index
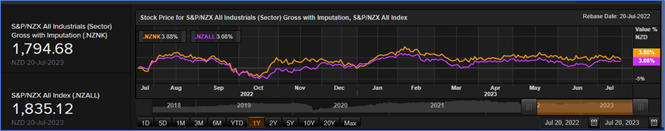
Source: REFINITIV
Key Risks and Challenges:
The softer demand outlook, increased inflation, tightening of monetary policies, fluctuations in the crude oil prices, etc. are some of the critical challenges faced by the industrials sector.
The BoE raised its policy rate 50bps to 5.0%, a larger increase than analysts anticipated. This followed the release of May’s CPI report which showed that inflation remained the highest in developed economies. There are no signs of easing of core inflation. Annual inflation remained steady at 8.7% but core inflation increased to 7.1% from 6.8% in April.
China decided to cut 2 of its key lending rates, as authorities plan to support the economy after signs of the slowdown in the post-COVID recovery. The 1-year and 5-year loan prime rates were cut by 10bp to 3.55% and 4.2%, respectively.
Exhibit 4. Key Risks in Industrials Sector:
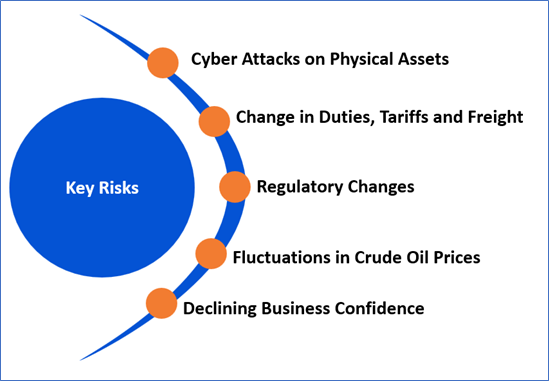
Source: Analysis by Kalkine Group
Outlook:
NZ’s current account deficit widened considerably, as a result of several factors including the disruption caused by the pandemic, poor agricultural production as well as increased global interest rates. The current account deficit started to narrow in the quarter ended March, falling to 8.5% of GDP. This trend is expected to continue. In the Budget forecast, the deficit is expected to decline to 3.8% of GDP by June 2027. This is anticipated to be supported by recovery in tourism, decline in the transport costs as well as when macroeconomic policy tightening weighs on the import demand.
The sustained recovery in tourism is expected to play the key role in the improvement in the services balance as well as the overall current account deficit. Notably, the factors supporting the recovery are the return of Chinese tourists, NZ’s 2nd largest pre-COVID tourist market. The increase in NZ’s international flight connectivity is expected to support higher visitor numbers.
While the higher government borrowing supported to mitigate the effects of COVID-19 pandemic on household incomes, the deterioration in the current account deficit reflected declines in net lending by each of the 3 main sectors. Therefore, returning to more sustainable levels would need adjustment in each of such sectors.
The government’s plans to return the budget to surplus is an integral part of rebalancing. Also, tighter monetary policy is contributing to rebalancing by prompting the private sector to save more. This is expected to take some pressure off imports. In the long term, the Treasury anticipates interest rates to return to more neutral levels as government as well as household spending slows, which is reflected in the narrowing of the current account deficit to the more sustainable level of ~4% of GDP.
Apart from the sector-specific factors, an analysis on 2 NZX-listed companies is provided. This report covers their insights, outlook, performance and potential as expected to be delivered in the near to medium term.
1) Steel & Tube Holdings Limited (Recommendation: Buy, Potential Upside: Low Double-Digit) (M-Cap: NZD 195.2 million, Annual Dividend Yield (TTM)1: 12.4%)
Business Description:
Steel & Tube Holdings Limited (NZX: STU) is one of NZ's leading providers of steel solutions, enabling access to the widest range of steel products in the market, through the nationwide network of distribution centres.
Outlook:
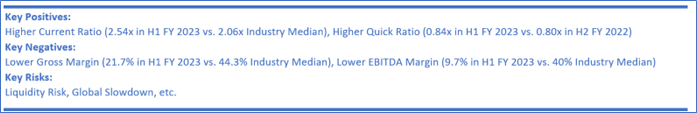
STU continued to perform well in the current tight economic conditions. As the result, the company is expecting that the full-year financial results would be at the top end of the guidance previously provided.
The company’s unaudited normalised EBITDA is expected between NZD 52 Mn – NZD 53 Mn and normalised EBIT is anticipated in the range of NZD 31 Mn -NZD 32 Mn. The company ended the financial year with no bank debt as well as the positive cash balance of $6.5 Mn, reflecting the ~$50 Mn improvement on FY 2022 after paying higher dividends and tax.
Technical Overview:
Daily Price Chart
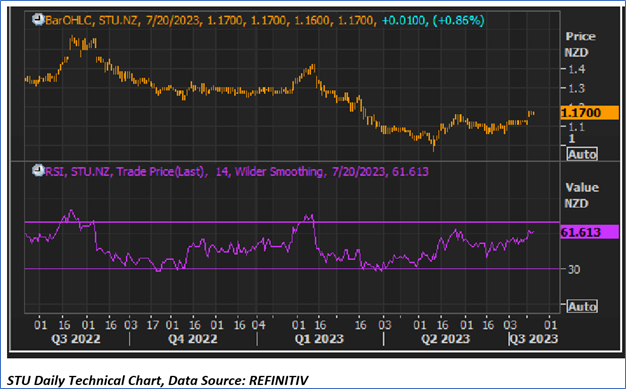
Technical Commentary
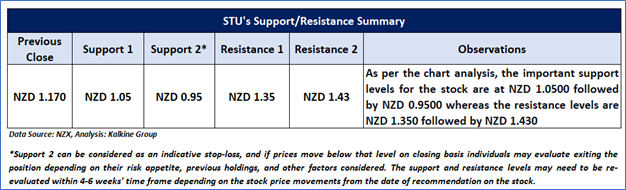
On the daily chart, STU prices are trading near the rising trendline support zone. Moreover, the momentum oscillator RSI (14-period) is showing a reading of ~61.613 level. Further, the prices are trading above the trend-following indicators 21-period SMA, which may act as a support zone. An important support level for the stock is placed at NZD 1.05 while the key resistance level is placed at NZD 1.35.
Fundamental Valuation
EV/Sales Based Relative Valuation
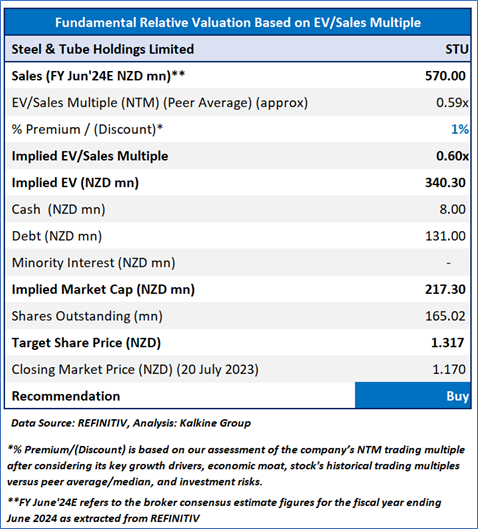
Stock Recommendation
Considering the aforementioned factors, a ‘Buy’ rating is given on the stock at the closing market price of NZD 1.17 per share, up by 0.86% as of 20th July 2023.
2) Skellerup Holdings Limited (Recommendation: Buy, Potential Upside: Low Double-Digit) (M-Cap: NZD 921.5 million, Annual Dividend Yield (TTM)1: 5.34%)
Business Description:
Skellerup Holdings Limited (NZX: SKL) designs, manufactures as well as sells engineered polymer products and vacuum systems for customers in dairy rubberware, water and related infrastructure, roofing, etc.
Outlook:
SKL has reaffirmed the expectations for another record year with FY 2023 NPAT forecast to be between $48 Mn - $52 Mn. Notably, the markets would remain challenging. However, the company is anticipating earnings to be stronger in the H2 of the year because of seasonal impacts as well as contribution from new products utilised in hygiene, potable water and flow control applications.
Technical Overview:
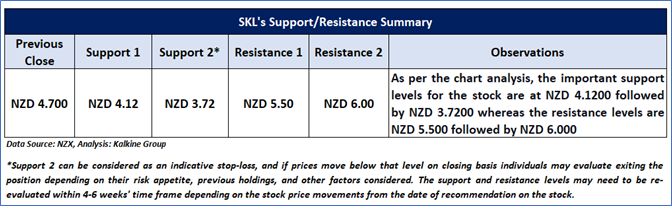
Daily Price Chart
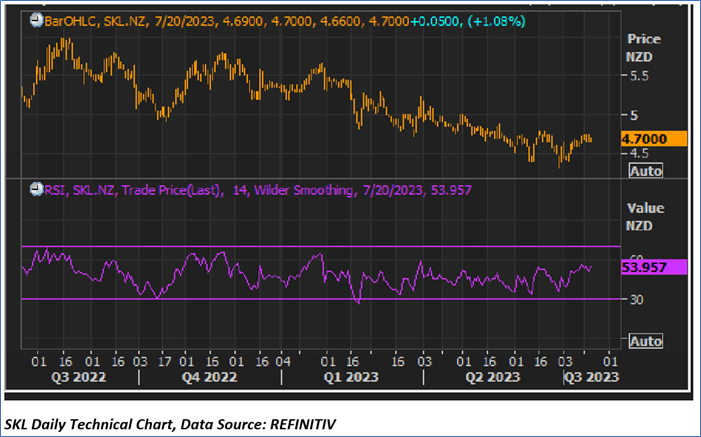
Technical Commentary
On the daily chart, SKL prices are trading near the rising trendline support zone. Moreover, the momentum oscillator RSI (14-period) is showing a reading of ~53.957 level. Further, the prices are trading above the trend-following indicators 21-period SMA, which may act as a support zone. An important support level for the stock is placed at NZD 4.12 while the key resistance level is placed at NZD 5.5.
Fundamental Valuation
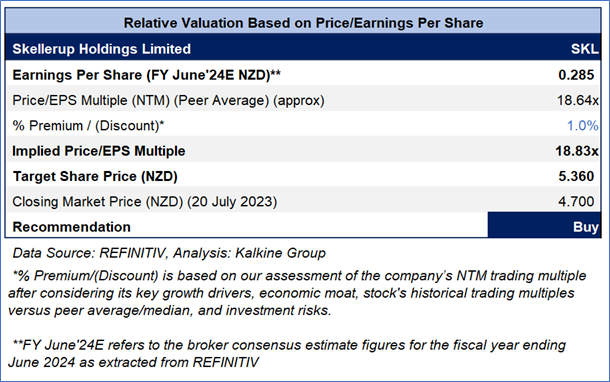
Stock Recommendation
Considering the aforementioned factors, a ‘Buy’ is given on the stock at the closing market price of NZD4.70 per share, up by 1.08% as on 20 July 2023.
Markets are trading in a highly volatile zone currently due to certain macro-economic issues and geopolitical tensions prevailing. Therefore, it is prudent to follow a cautious approach while investing.
Note 1: Past performance is neither an indicator nor a guarantee of future performance.
Note 2: The reference date for all price data, currency, technical indicators, support, and resistance levels is July 20, 2023. The reference data in this report has been partly sourced from REFINITIV.
Note 3: Investment decisions should be made depending on an individual's appetite for upside potential, risks, holding duration, and any previous holdings. An 'Exit' from the stock can be considered if the Target Price mentioned as per the Valuation and or the technical levels provided has been achieved and is subject to the factors discussed above.
Note 4: Annual Dividend Yield is on a Trailing Twelve Month (TTM1) basis and are subject to change based on factors such as company performance, stock price changes, etc.
Technical Indicators Defined: -
Support: A level at which the stock prices tend to find support if they are falling, and a downtrend may take a pause backed by demand or buying interest. Support 1 refers to the nearby support level for the stock and if the price breaches the level, then Support 2 may act as the crucial support level for the stock.
Resistance: A level at which the stock prices tend to find resistance when they are rising, and an uptrend may take a pause due to profit booking or selling interest. Resistance 1 refers to the nearby resistance level for the stock and if the price surpasses the level, then Resistance 2 may act as the crucial resistance level for the stock.
Stop-loss: It is a level to protect further losses in case of unfavourable movement in the stock prices.
Disclaimer
Kalkine New Zealand Limited is a Financial Advice Provider (“FAP”) and is authorised by a Class 1 Financial Advice Provider Licence issued by Financial Markets Authority (“FMA”) to provide financial advice. Kalkine provides only general financial advice through its research reports following a person becoming a member. The reports contain buy/sell/hold and other recommendations in relation to equity financial products. The recommendations and opinions [on this website] / [in this report] do not take into account any of your investment objectives, financial situation or needs. Before you make a decision about whether to acquire a financial product, you should obtain the Product Disclosure Statement from the product issuer. You should consider the appropriateness of advice taking into account your own objectives, financial situation and needs and seek independent financial advice before making any financial decisions. If you act on the advice in the research reports, you may have to pay fees, expenses or other amounts (but not to Kalkine). Further information about the complaints and dispute resolution process, as well as information about Kalkine’s duties are available on Kalkine’s website. Please read our Financial Advice Provider (FAP) disclosure statement and Complaints Handling Guide, which are available on the website.
Past performance is not a reliable indicator of future performance.
 Please wait processing your request...