
I. Sector Landscape and Outlook
As per the Ministry of Business, Innovation and Employment (MBIE), technological transformation, changes in consumer preferences and demands, an increased focus on the critical role energy plays in business competitiveness, volatility in commodity prices as well as the need to transition to lower carbon economy -all factors are critical in the domestic and international energy context.
In the New Zealand Energy Efficiency And Conservation Strategy (2017-2022) report, it was mentioned that, as a party to the historic Paris Agreement on climate change, NZ is committed towards reducing greenhouse gas emissions. Notably, the target is to reduce emissions to 30% below 2005 levels by 2030. The three priority areas include renewable and efficient use of process heat, efficient and low-emissions transport as well as innovative and efficient use of electricity. With respect to the electricity target, the government retained the existing renewable electricity target of 90% by 2025. Electricity is the priority area, with main focus towards supporting technology uptake as well as innovation.
Highest Share of Primary Energy from Renewable Sources
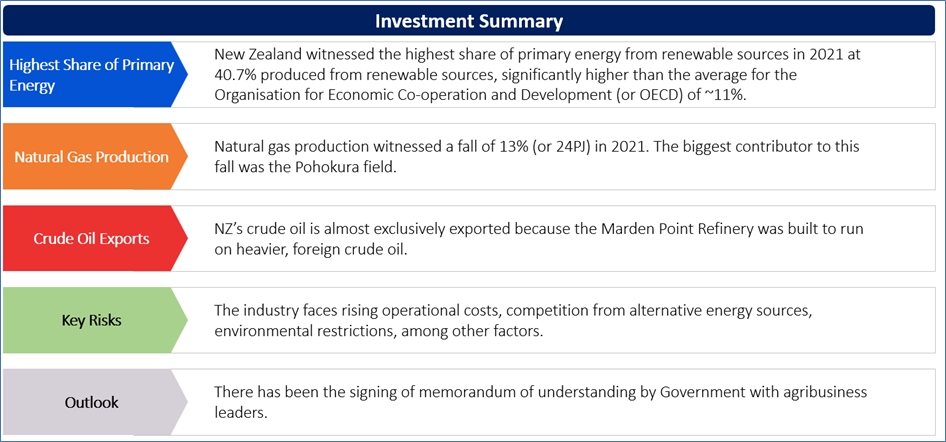
A significant amount of NZ's total primary energy supply (TPES) comes from renewable resources. Notably, hydro, geothermal, wind as well as bioenergy are used to produce electricity in NZ. New Zealand witnessed the highest share of primary energy from renewable sources in 2021 at 40.7% produced from renewable sources, significantly higher than the average for the Organisation for Economic Co-operation and Development (or OECD) of ~11%.
The 2021 calendar year witnessed 2 large new wind farms constructed at Waipipi and Turitea as well as the first full year of the expansion to the Ngāwhā geothermal power plant operating. NZ’s renewable share of total primary energy supply (TPES) rose to 40.8% in 2021, reflecting a slight rise from 40.4% in 2020. The government has committed to setting a target of 50% of the total energy consumption coming from renewable sources by the year 2035. The country’s renewable share of energy consumption in 2021 stood at 28.4%, reflecting a rise from 28.1 per cent in 2020.
The rise in the renewable share of energy consumption in 2021 was due to the increases in the direct use of solid biofuels as well as electricity generation from wind turbines.
Exhibit 1: Share of Total Primary Energy Supply from Renewable Sources
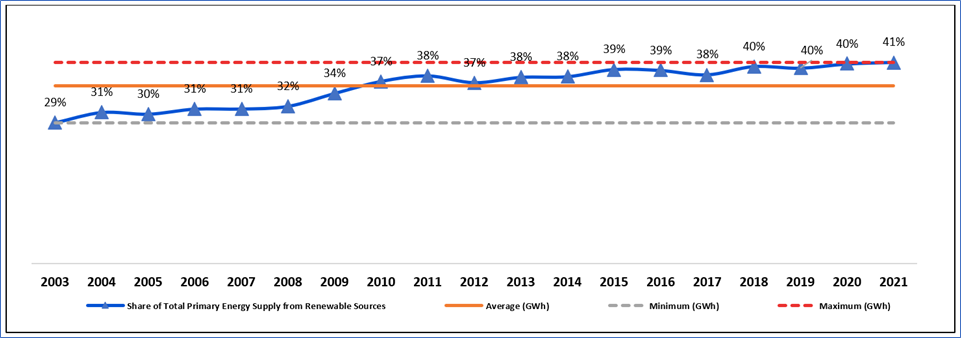
Data Source: This work is owned by the Ministry of Business, Innovation and Employment on behalf of the Crown which are licensed for reuse under the Creative Commons Attribution 4.0 International Licence; Chart Created by Kalkine Group
Decline in Natural Gas Production
Natural gas production witnessed a fall of 13% (or 24PJ) in 2021. The biggest contributor to this fall was the Pohokura field, where production declined 31% (17 PJ). By contrast, Maui’s production rose 15% (or 3.9PJ). This was due to the development work on the field during 2021, which continued into 2022. The future production of natural gas – measured by natural gas reserves production profiles as reported by field operators– is higher as compared to the last year. Peak production is still expected to take place in 2024 but is at the slightly higher level at 215PJ (up 2.6% from last year).
On the basis of forecasts from the Climate Change Commission (or CCC) and Ministry of Business, Innovation and Employment, NZ would need to produce between 2,290 and 3,165PJ from 2022 to 2050 in order to address demand.
Total indigenous crude oil production declined 13% (1.0 million barrels) in 2021. Notably, the key driver of this decline was the Pohokura field where production witnessed a fall of 35% (0.6 million barrels). NZ’s crude oil is almost exclusively exported because the Marden Point Refinery was built to run on heavier, foreign crude oil. Notably, only 3.4% of the crude oil utilised by the refinery in 2021 was indigenously produced.
Exhibit 2: Net Generation (Since March 2018 Quarter)
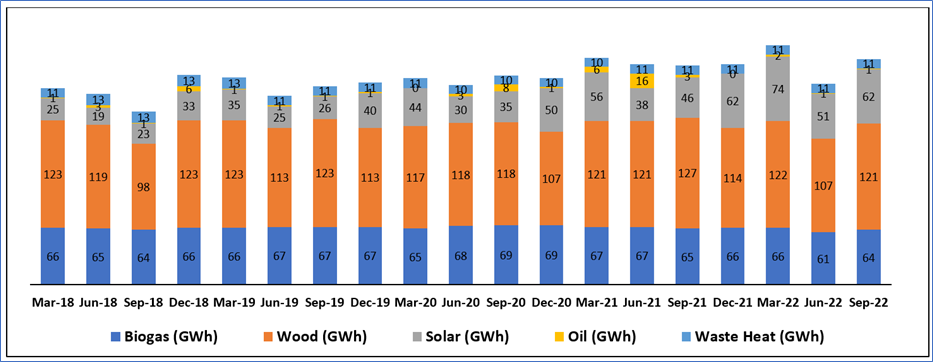
Data Source: This work is owned by the Ministry of Business, Innovation and Employment on behalf of the Crown which are licensed for reuse under the Creative Commons Attribution 4.0 International Licence; Chart Created by Kalkine Group
Index Performance:
The S&P/NZX All Energy (Sector) Index generated a 6-month return of ~15.07% versus ~5.37% by the S&P/NZX 50 Index. Therefore, NZX All Energy Index overperformed NZX50 Index by ~9.7% in 6 months.
Exhibit 3: S&P/NZX All Energy (Sector) vs S&P/NZX50 Index

Source: REFINITIV
Key Risks and Challenges:
NZ’s energy production comes from renewable as well as non-renewable sources. New Zealand imports and exports fossil fuels which garner export revenue, but also results in the dependency as well as vulnerability to energy commodity prices. These prices might vary as per the international supply and demand factors which are beyond New Zealand’s control.
The national electricity demand also depends on several factors. There could be a decrease in industrial and agriculture use which might impact the national demand of electricity. Notably, the power sector is also exposed to significant changes in the climate suitable for energy generation. Increase in water temperature, air temperature, etc. could impact the generation efficiency.
Exhibit 4. Key Risks in Utilities Sector:

Source:- Analysis: Kalkine Group
Outlook:
NZ’s effort to reduce agricultural emissions has taken a step forward as there has been the signing of memorandum of understanding by Government with agribusiness leaders, in JV as part of the new Centre for Climate Action on Agricultural Emissions. Initial indicative commitments would witness ~$172 Mn deployed over the next 4 years by industry as well as government to build and commercialise practical tools and technologies for farmers.
The JV represents the key component of the Centre for Climate Action on Agricultural Emissions. The Centre was announced as part of the $338.7 Mn in funding allotted over the next 4 years in order to strengthen the role of R&D for new tools as well as technologies for the reduction of on-farm emissions which was announced in Budget 2022. The agriculture sector contributes 50% of Aotearoa New Zealand’s gross greenhouse gas emissions, and ~91% of the biogenic methane emissions.
The Government has committed to the net-zero target for 2050 and reducing biogenic methane emissions by 10% by 2030, relative to 2017 levels as well as 24%-47% lower by 2050.
Apart from the sector-specific factors, an analysis on 2 NZX-listed companies is provided. This report covers their insights, outlook, performance and potential as expected to be delivered in the near to medium term.
1) Vital Limited (Recommendation: Speculative Buy, Potential Upside: Low Double-Digit) (M-Cap: NZD12.88 million)
Business Description:
Vital Limited (NZX: VTL) is engaged in providing a communications network in New Zealand.
Outlook:
The company is expecting to generate revenues and NPAT (excluding IFRS16) between NZD27.5-28.5 mn and NZD0.0-0.2 mn, respectively in FY 2023. In FY 2024, NPAT (excluding IFRS16) is expected to come between NZD0.7 Mn - NZD1.1 Mn and revenues between NZD28.0 Mn - NZD29.0 Mn. The management forecasts a decline in the capital expenditure to NZD4.1 million in FY23 and a further reduction in FY24.
Technical Overview:
Daily Price Chart
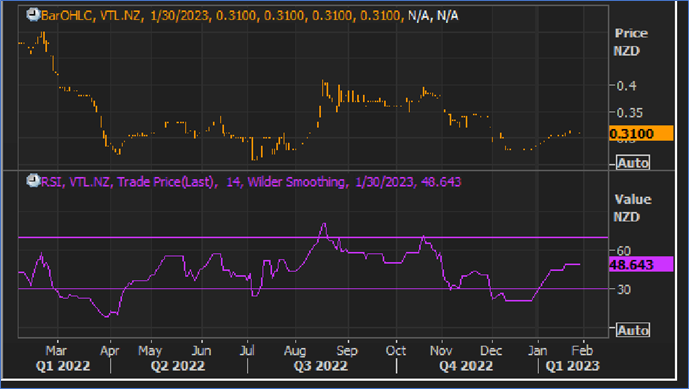
Source: REFINITIV, Note: Purple color line reflects Relative Strength Index (14-Period)
Technical Commentary
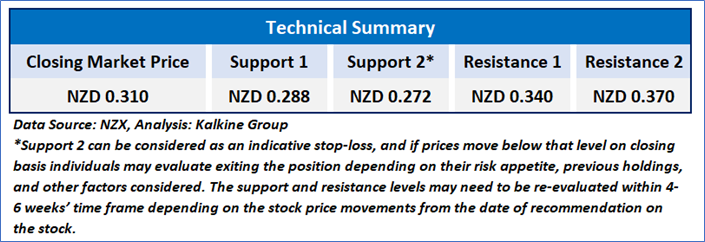
VTL prices are in a consolidation phase on the chart and taking support at the at the horizontal trendline, indicating the possibility of upside. Moreover, momentum indicator RSI (14-period) is placed below the mid-point and shows a reading of ~48.643. An important support level for the stock is placed at NZD0.288 while the key resistance level is placed at NZD0.340.
Stock Recommendation
On a TTM basis, the stock of VTL is trading at an EV/EBITDA multiple of 4.9x compared to the industry (Telecommunications Services) median of 9.8x, and thus seems undervalued.
The company's first quarter remains broadly in line with budget. Further, it focuses on driving free cash flow through a targeted strategy to generate revenue growth off network investments, lowering and optimising costs to serve customers as well as ruthless management of capital expenditure.
Considering the facts above and undervaluation as indicated by the TTM valuation, a ‘Speculative Buy’ recommendation on the stock has been provided at the closing market price of NZD0.310 per share as of 30 January 2023.
2) NZ Windfarms Limited (Recommendation: Speculative Buy, Potential Upside: Low Double-Digit) (M-Cap: NZD42.06 million, Annual Dividend Yield (TTM)1: 5.0%)
Business Description:
NZ Windfarms Limited (NZX: NWF) is engaged in the business of wind farm as it is a specialist wind farm owner and operator. The company makes revenue from the sale of electricity which is generated from its Te Rere Hau wind farm.
Outlook:
The Board reaffirmed its forward EBITDAF guidance for FY 2023 of NZD5.0 million - NZD6.5 million. NWF announced an unimputed FY 2023 Q1 dividend of $0.0005 per share. The Board has taken the prudent approach to maintain higher cash levels in order to cover expected costs from repower consenting as well as feasibility workstreams.
Technical Overview:
Daily Price Chart
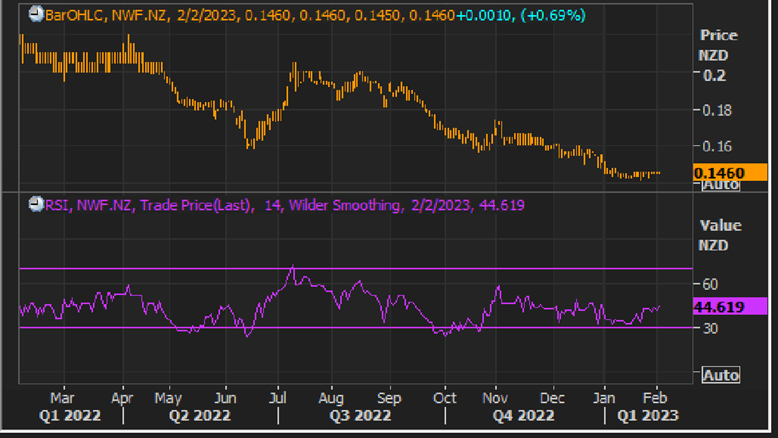
Source: REFINITIV, Note: Purple color line reflects Relative Strength Index (14-Period)
Technical Commentary
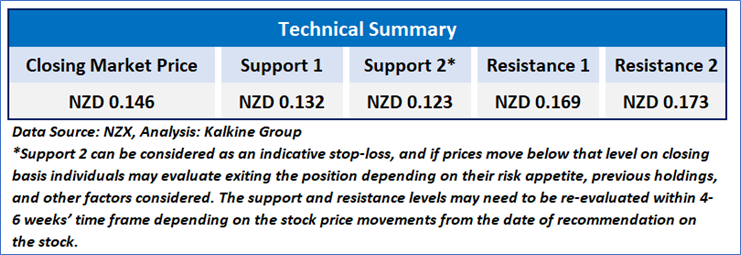
NWF prices are moving around its crucial support zone and stock prices seem to rebound after forming a base near the immediate support levels. Moreover, momentum indicator RSI (14-period) is placed below the mid-point and shows a reading of ~. An important support level for the stock is placed at NZD0.132 while the key resistance level is placed at NZD0.169
Stock Recommendation
Considering the aforementioned factors, and undervaluation as indicated by the TTM valuation, a ‘Speculative Buy’ is given on the stock at the closing market price of NZD0.146 per share, up by 0.69% as of 2 February 2023.
Markets are trading in a highly volatile zone currently due to certain macro-economic issues and geopolitical tensions prevailing. Therefore, it is prudent to follow a cautious approach while investing.
Note 1: Past performance is neither an indicator nor a guarantee of future performance.
Note 2: The reference date for all price data, currency, technical indicators, support, and resistance levels is February 2, 2023. The reference data in this report has been partly sourced from REFINITIV.
Note 3: Investment decisions should be made depending on an individual's appetite for upside potential, risks, holding duration, and any previous holdings. An 'Exit' from the stock can be considered if the Target Price mentioned as per the Valuation and or the technical levels provided has been achieved and is subject to the factors discussed above.
Note 4: Annual Dividend Yield is on a Trailing Twelve Month (TTM1) basis and are subject to change based on factors such as company performance, stock price changes, etc.
Technical Indicators Defined: -
Support: A level at which the stock prices tend to find support if they are falling, and a downtrend may take a pause backed by demand or buying interest. Support 1 refers to the nearby support level for the stock and if the price breaches the level, then Support 2 may act as the crucial support level for the stock.
Resistance: A level at which the stock prices tend to find resistance when they are rising, and an uptrend may take a pause due to profit booking or selling interest. Resistance 1 refers to the nearby resistance level for the stock and if the price surpasses the level, then Resistance 2 may act as the crucial resistance level for the stock.
Stop-loss: It is a level to protect further losses in case of unfavourable movement in the stock prices.
Disclaimer
Kalkine New Zealand Limited is a Financial Advice Provider (“FAP”) and is authorised by a Transitional FAP license issued by Financial Markets Authority (“FMA”) to provide financial advice. Kalkine provides only general financial advice through its research reports following a person becoming a member. The reports contain buy/sell/hold and other recommendations in relation to equity financial products. The recommendations and opinions [on this website] / [in this report] do not take into account any of your investment objectives, financial situation or needs. Before you make a decision about whether to acquire a financial product, you should obtain the Product Disclosure Statement from the product issuer. You should consider the appropriateness of advice taking into account your own objectives, financial situation and needs and seek independent financial advice before making any financial decisions. If you act on the advice in the research reports, you may have to pay fees, expenses or other amounts (but not to Kalkine). Further information about the complaints and dispute resolution process, as well as information about Kalkine’s duties are available on Kalkine’s website. Please read our Financial Advice Provider (FAP) disclosure statement and Complaints Handling Guide, which are available on the website.
Past performance is not a reliable indicator of future performance.
 Please wait processing your request...