Global Commodity Market Wrap-Up
The metals market had a strong performance last week, with precious metals maintaining their upward momentum while base metals saw mixed results. Gold surged by 1.85%, reaching a new high, and silver climbed by 0.55%. Base metals also showed bullish trends, with copper rising by 3.88%, lead increasing by 2.11%, and zinc jumping by 3.45%. These movements reflect shifts in investor sentiment and varying demand across metal sectors. After a period of stability, the market entered a more volatile phase, with changing dynamics expected to impact prices shortly. The overall market outlook remains uncertain, influenced by evolving trends..
Last week, natural gas prices surged by 7.98%, driven by supply constraints and increased seasonal demand. Crude oil prices, on the other hand, dropped by 1.72%, as market uncertainty and changing investor sentiment weighed on prices. Meanwhile, U.S. sugar prices remained almost unchanged, rising by just 0.05%, in contrast to other agricultural commodities, which experienced declines. These movements reflect the ongoing effects of supply-demand dynamics, with investors adjusting their strategies amid global economic uncertainty. Both the energy and agricultural sectors are navigating a period of heightened volatility, influenced by supply disruptions and shifting demand patterns, which are expected to continue shaping price trends.
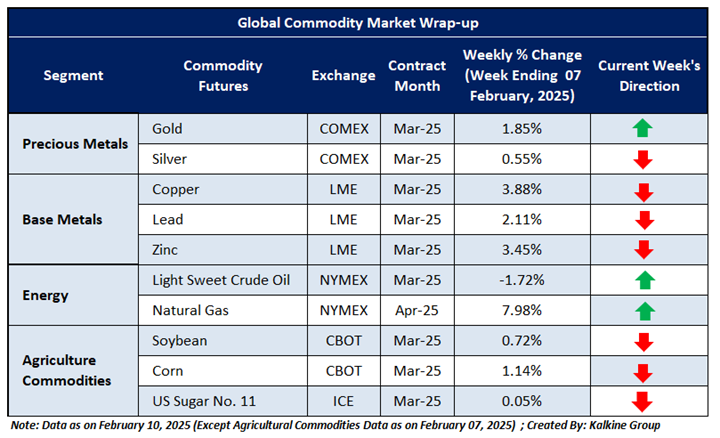
Global commodity prices have found stability near key support levels, influenced by various global factors. Precious metals continue to trade above critical support zones, indicating the potential for a bullish trend. In the energy sector, natural gas remains volatile with a broad price range, while crude oil is showing signs of recovery from solid support levels. Agricultural commodities are facing downward pressure, impacted by varying sector-specific conditions. This market environment, marked by both stability and volatility, requires a cautious approach. Investors are closely monitoring economic and geopolitical developments, weighing risks and opportunities as they navigate the evolving landscape in the commodities market.
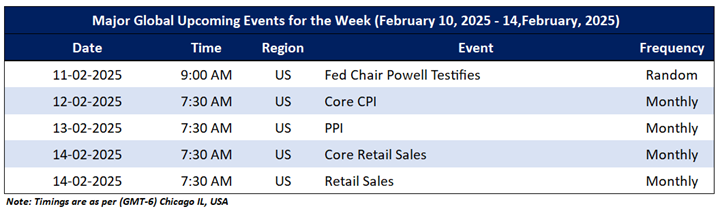
The upcoming Micro and Macroeconomic events that may impact market sentiments include an update Core CPI, PPI, Core Retail Sales and Retail Sales.
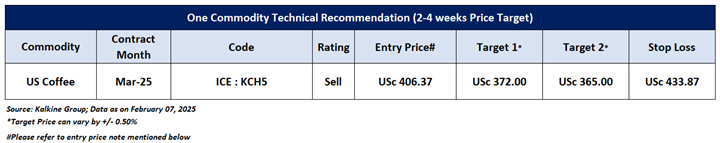
Having understood the global commodities performance over the past week, taking cues from major global economic events, and based on technical analysis, noted below is the recommendation with the generic insights, entry price, target prices, and stop-loss US Coffee March Future (ICE: KCH5) for the next 2-4 weeks duration:
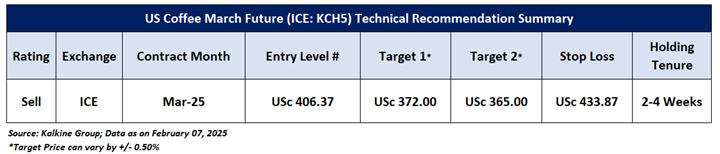
US Coffee March Future (ICE: KCH5)
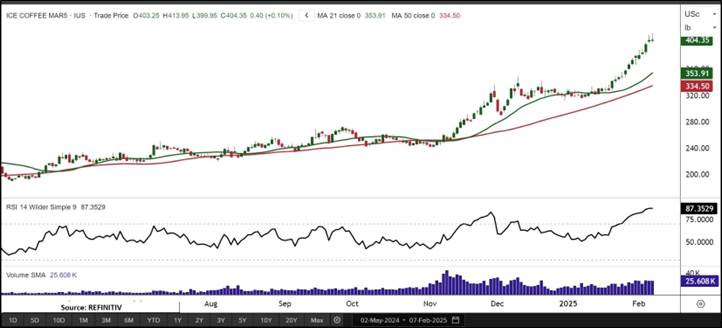
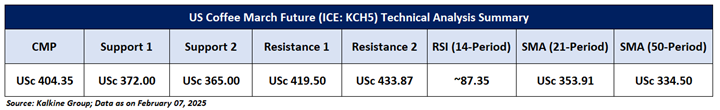
Price Action and Technical Indicator Analysis: Coffee futures for March are trading below a horizontal trendline and have formed a candlestick pattern that suggests a loss of momentum, signalling the potential for a short-term correction. Increased trading volume indicates a possible slowdown in the current uptrend after reaching recent highs. On the daily chart, a strong resistance level further emphasizes the weakening bullish momentum. The Relative Strength Index (RSI) stands at 87.35, reflecting an overbought condition, which could limit further upside in the short term. Meanwhile, the 50-period simple moving average (SMA) provides support. These technical indicators suggest a loss of upward momentum for coffee, with the market potentially entering a consolidation phase.
Now the next crucial support levels appear to be at USc 372.00 and USc 365.00, and prices may test these levels in the coming periods (2-4 weeks).
As per the above-mentioned price action and technical indicators analysis, US Coffee March Future (ICE: KCH5) is looking technically well-placed for a ‘Sell’ rating. Investment decisions should be made depending on an individual’s appetite for downside potential, risks, and any previous holdings. This recommendation is purely based on technical analysis, and fundamental analysis has not been considered in this report. Technical summary of the ‘Sell’ recommendation is as follows:
Upcoming Major Global Economic Events
Market events occur on a day-to-day basis depending on the frequency of the data and generally include an update on employment, inflation, GDP, WASDE report, consumer sentiments, etc. Noted below are the upcoming week's major global economic events that could impact commodities’ prices:
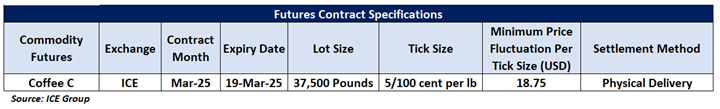
Futures Contract Specifications
Disclaimers
Related Risks: Based on the technical analysis, the risks are defined as per risk-reward ratio (~0.80:1.00), however, returns are generated within a 2-4 weeks’ time frame. This may be looked at by Individuals with sufficient risk appetite looking for returns within short investment duration. The investment recommendations provided in this report are solely based on technical parameters, and the fundamental performance of the commodities has not been considered in the decision-making process. Other factors which could impact commodity prices include market risks, regulatory risks, interest rates risk, currency risks, and social and political instability risks etc.
Note 1: Past performance is not a reliable indicator of future performance.
Note 2: Individuals can consider exiting from the commodity if the Target Price mentioned as per the Technical Analysis has been achieved and subject to the factors discussed above.
Note 3: How to Read the Charts?
The Green colour line reflects the 21-period moving average while the red line indicates the 50- period moving average. SMA helps to identify existing price trend. If the prices are trading above the 21-period and 50-period moving average, then it shows prices are currently trading in a bullish trend.
The Black colour line in the chart’s lower segment reflects the Relative Strength Index (14-Period) which indicates price momentum and signals momentum in trend. A reading of 70 or above suggests overbought status while a reading of 30 or below suggests an oversold status.
The Blue colour bars in the chart’s lower segment show the volume of the commodity. Commodity with high volumes is more liquid compared to the lesser ones. Liquidity in commodity helps in easier and faster execution of the order.
The Orange colour lines are the trend lines drawn by connecting two or more price points and used for trend identification purposes. The trend line also acts as a line of support and resistance.
Technical Indicators Defined: -
Support: A level at which the stock prices tend to find support if they are falling, and a downtrend may take a pause backed by demand or Selling interest. Support 1 refers to the nearby support level for the stock and if the price breaches the level, then Support 2 may act as the crucial support level for the stock.
Resistance: A level at which the stock prices tend to find resistance when they are rising, and an uptrend may take a pause due to profit booking or Selling interest. Resistance 1 refers to the nearby resistance level for the stock and if the price surpasses the level, then Resistance 2 may act as the crucial resistance level for the stock.
Stop-loss: It is a level to protect further losses in case of unfavourable movement in the stock prices.
Risk Reward Ratio: The risk reward ratio is the difference between an entry point to a stop loss and profit level. This report is based on ~80% Stop Loss of the Target 1 from the entry point.
The reference date for all price data, volumes, technical indicators, support, and resistance levels is February 07, 2025. The reference data in this report has been partly sourced from REFINITIV.
Note: Trading decisions require a thorough analysis by individuals. Technical reports, in general, chart out metrics that may be assessed by individuals before any commodity evaluation. The above are illustrative analytical factors used for evaluating the commodity; other parameters can be looked at along with additional risks per se.
Disclaimer This report has been issued by Kalkine New Zealand Limited (FSP691351) (NZBN:9429047678101) (“Kalkine”). Kalkine is a Financial Advice Provider (“FAP”) and is authorised by a Class 1 Financial Advice Provider Licence issued by Financial Markets Authority (“FMA”) to provide financial advice. Kalkine provides only general financial advice through its research reports following a person becoming a member. The reports contain buy/sell/hold and other recommendations in relation to equity securities, managed funds and other managed investment schemes and other financial advice products. The recommendations and opinions in this report and on Kalkine website do not take into account any of your investment objectives, financial situation or needs. Before you make a decision about whether to acquire a financial product, you should obtain the Product Disclosure Statement from the product issuer. You should consider the appropriateness of advice taking into account your own objectives, financial situation and needs and seek independent financial advice before making any financial decisions. If you act on the advice in the research reports, you may have to pay fees, expenses or other amounts (but not to Kalkine). Further information about the complaints and dispute resolution process, as well as information about Kalkine’s duties are available on Kalkine’s website. Please read our Financial Advice Provider (FAP) disclosure statement and Complaints Handling Guide, which are available on the website.
Past performance is not a reliable indicator of future performance.
 Please wait processing your request...