
Global Commodity Market Wrap-Up
The metals market witnessed renewed momentum last week amid heightened geopolitical tensions and global economic uncertainty, prompting investors to seek safety in precious and industrial metals. Gold surged 3.27% and silver gained 0.71%, signaling increased demand for safe-haven assets. Among base metals, copper dipped 0.46% and zinc declined 1.27%, while lead edged up 0.60%, reflecting mixed sentiment in the industrial segment. The overall movement indicates a cautious shift in investor positioning, balancing risk aversion with selective interest in cyclical assets. Markets remain focused on upcoming central bank signals and persistent concerns surrounding the broader economic outlook and regional geopolitical developments.
Natural gas prices fell 4.66% last week amid weakening seasonal demand and lingering supply concerns. In contrast, crude oil surged 12.04%, fueled by rising Middle East tensions and expectations of tighter global supply, boosting overall market sentiment. Meanwhile, U.S. sugar prices declined 1.72%, defying the broader agricultural trend. These contrasting movements underscore ongoing supply-demand imbalances and the heightened sensitivity of commodity markets to geopolitical and economic developments. As volatility remains elevated across the energy and agricultural segments, investors should closely monitor macroeconomic indicators and sector-specific drivers that may influence short-term price direction and trading opportunities in the commodities landscape.
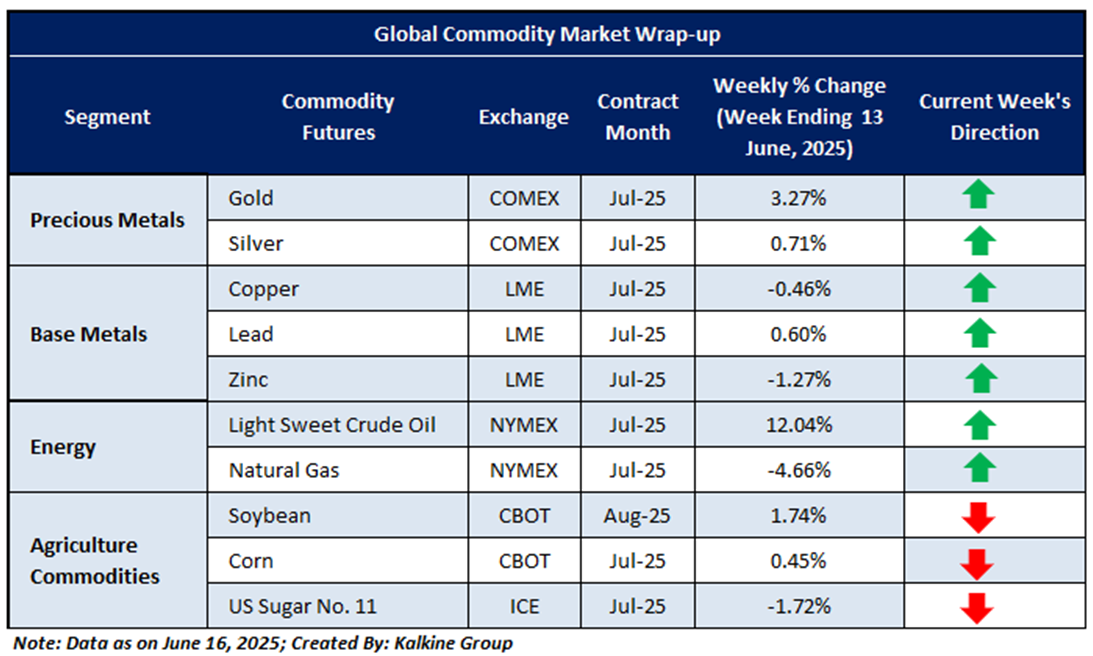
Global commodity prices extended their bullish trend last week, underpinned by improving sentiment despite persistent macroeconomic and geopolitical headwinds. Precious metals hovered near key resistance levels, indicating consolidation as investors reassessed risk appetite. Crude oil continued its upward momentum, driven by hopes of recovery and a tightening supply outlook, while natural gas traded with high volatility within a broad range. Agricultural commodities remained steady, supported by firm demand and favorable sector-specific fundamentals. Overall, markets reflected a cautiously optimistic stance, with participants selectively positioning ahead of key economic data releases and central bank policy signals, keeping a close eye on global developments.
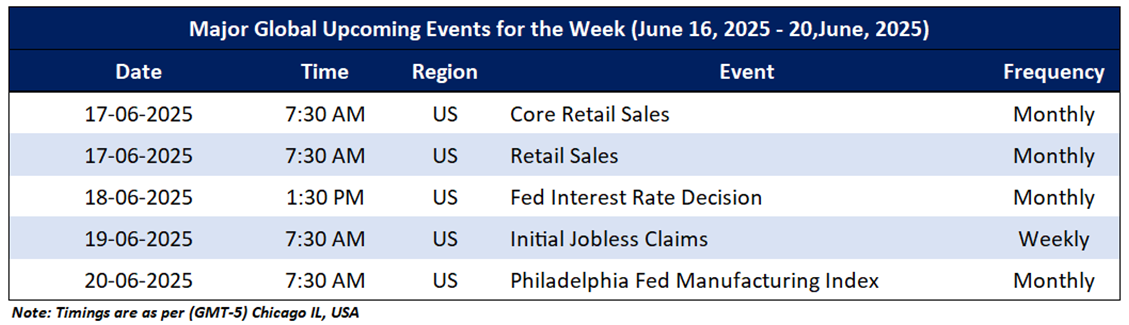
The upcoming Micro and Macroeconomic events that may impact on market sentiments include an update Core Retail Sales, Retail Sales, Fed Interest Rate Decision, Initial Jobless Claims and Philadelphia Fed Manufacturing Index.
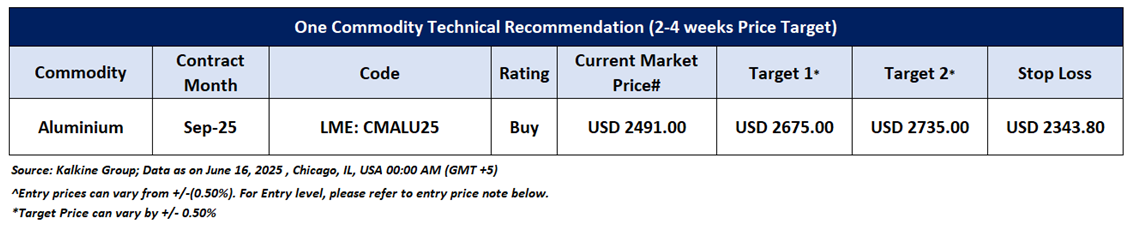
Having understood the global commodities’ performance over the past week, taking cues from major global economic events, and based on technical analysis, noted below is the recommendation with generic insights, entry price, target prices, and stop-loss Aluminium September Future (LME: CMALU25) for the next 2-4 weeks duration:
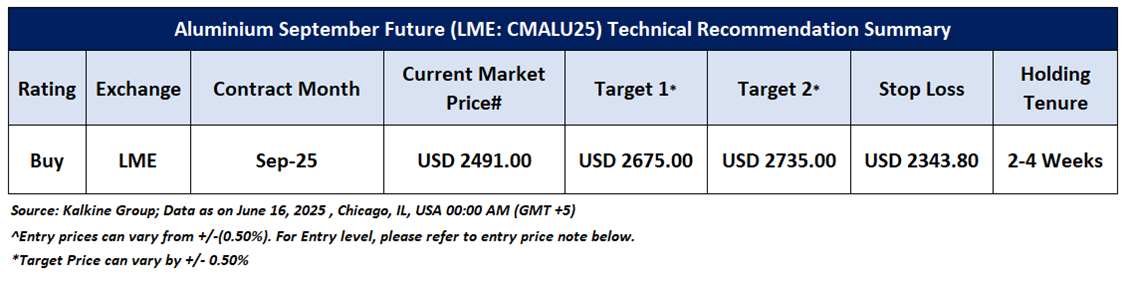
Aluminium September Future (LME: CMALU25)
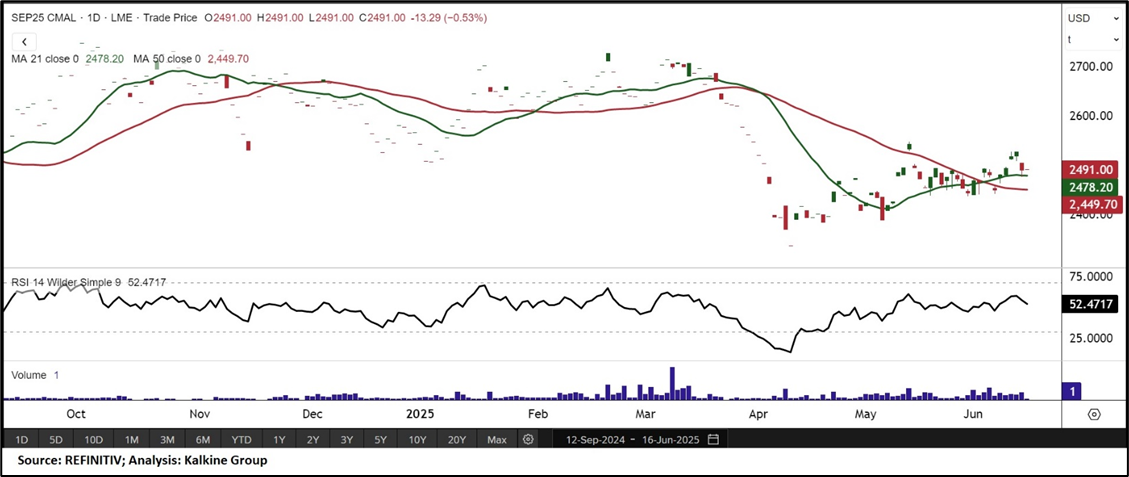
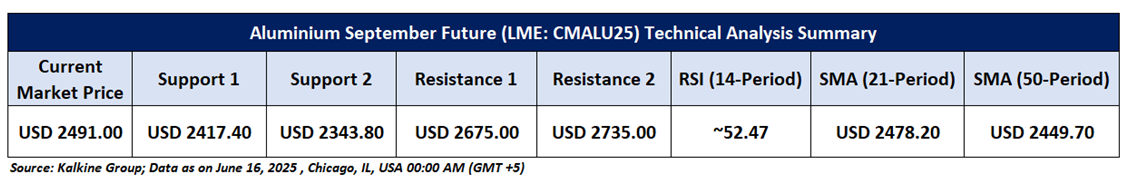
Price Action and Technical Indicator Analysis: September Aluminium futures show continued bullish resilience, trading steadily above key support levels and the 21-period Simple Moving Average, indicating strong underlying market sentiment. The 50-period SMA serves as a firm base, reinforcing the ongoing uptrend. With the Relative Strength Index (RSI) at 52.47, momentum appears stable, and the potential for a bullish divergence adds weight to the upward bias. This technical setup suggests a positive near-term outlook. A breakout above immediate resistance could confirm a new bullish phase, while sustained support levels may lead to consolidation. Overall, the trend remains constructive, with increasing momentum supporting further upside potential.
Now the next crucial resistance levels appear to be at USD 2675.00 and USD 2735.00, and prices may test these levels in the coming periods (2-4 weeks).
As per the above-mentioned price action and technical indicators analysis, Aluminium September Future (LME: CMALU25) is looking technically well-placed for a ‘Buy’ rating. Investment decisions should be made depending on an individual’s appetite for downside potential, risks, and any previous holdings. This recommendation is purely based on technical analysis, and fundamental analysis has not been considered in this report. Technical summary of the ‘Buy’ recommendation is as follows:
Upcoming Major Global Economic Events
Market events occur on a day-to-day basis depending on the frequency of the data and generally include an update on employment, inflation, GDP, WASDE report, consumer sentiments, etc. Noted below are the upcoming week's major global economic events that could impact commodities’ prices:
Futures Contract Specifications
Disclaimers
Related Risks: Based on the technical analysis, the risks are defined as per risk-reward ratio (~0.80:1.00), however, returns are generated within a 2-4 weeks’ time frame. This may be looked at by Individuals with sufficient risk appetite looking for returns within short investment duration. The investment recommendations provided in this report are solely based on technical parameters, and the fundamental performance of the commodities has not been considered in the decision-making process. Other factors which could impact commodity prices include market risks, regulatory risks, interest rates risk, currency risks, and social and political instability risks etc.
Note 1: Past performance is not a reliable indicator of future performance.
Note 2: Individuals can consider exiting from the commodity if the Target Price mentioned as per the Technical Analysis has been achieved and subject to the factors discussed above.
Note 3: How to Read the Charts?
The Green colour line reflects the 21-period moving average while the red line indicates the 50- period moving average. SMA helps to identify existing price trend. If the prices are trading above the 21-period and 50-period moving average, then it shows prices are currently trading in a bullish trend.
The Black colour line in the chart’s lower segment reflects the Relative Strength Index (14-Period) which indicates price momentum and signals momentum in trend. A reading of 70 or above suggests overbought status while a reading of 30 or below suggests an oversold status.
The Blue colour bars in the chart’s lower segment show the volume of the commodity. Commodity with high volumes is more liquid compared to the lesser ones. Liquidity in commodity helps in easier and faster execution of the order.
The Orange colour lines are the trend lines drawn by connecting two or more price points and used for trend identification purposes. The trend line also acts as a line of support and resistance.
Technical Indicators Defined: -
Support: A level at which the stock prices tend to find support if they are falling, and a downtrend may take a pause backed by demand or Selling interest. Support 1 refers to the nearby support level for the stock and if the price breaches the level, then Support 2 may act as the crucial support level for the stock.
Resistance: A level at which the stock prices tend to find resistance when they are rising, and an uptrend may take a pause due to profit booking or Selling interest. Resistance 1 refers to the nearby resistance level for the stock and if the price surpasses the level, then Resistance 2 may act as the crucial resistance level for the stock.
Stop-loss: It is a level to protect further losses in case of unfavourable movement in the stock prices.
Risk Reward Ratio: The risk reward ratio is the difference between an entry point to a stop loss and profit level. This report is based on ~80% Stop Loss of the Target 1 from the entry point.
The reference date for all price data, volumes, technical indicators, support, and resistance levels is 16th June 2025. The reference data in this report has been partly sourced from REFINITIV.
Note: Trading decisions require a thorough analysis by individuals. Technical reports, in general, chart out metrics that may be assessed by individuals before any commodity evaluation. The above are illustrative analytical factors used for evaluating the commodity; other parameters can be looked at along with additional risks per side.
Disclaimer This report has been issued by Kalkine New Zealand Limited (FSP691351) (NZBN:9429047678101) (“Kalkine”). Kalkine is a Financial Advice Provider (“FAP”) and is authorised by a Class 1 Financial Advice Provider Licence issued by Financial Markets Authority (“FMA”) to provide financial advice. Kalkine provides only general financial advice through its research reports following a person becoming a member. The reports contain buy/sell/hold and other recommendations in relation to equity securities, managed funds and other managed investment schemes and other financial advice products. The recommendations and opinions in this report and on Kalkine website do not take into account any of your investment objectives, financial situation or needs. Before you make a decision about whether to acquire a financial product, you should obtain the Product Disclosure Statement from the product issuer. You should consider the appropriateness of advice taking into account your own objectives, financial situation and needs and seek independent financial advice before making any financial decisions. If you act on the advice in the research reports, you may have to pay fees, expenses or other amounts (but not to Kalkine). Further information about the complaints and dispute resolution process, as well as information about Kalkine’s duties are available on Kalkine’s website. Please read our Financial Advice Provider (FAP) disclosure statement and Complaints Handling Guide, which are available on the website.
Past performance is not a reliable indicator of future performance.
 Please wait processing your request...