This report is an updated version of the report published on 28 November 2025 at 11:55 AM AEDT.
Section 1: Company Overview, Low Carbon Emission Initiatives and Fundamentals
Section 1.1 Bellevue Gold Limited is an Australian Securities Exchange (ASX) listed gold mining and exploration company focused on the development and operation of the high-grade Bellevue Gold Project, located in the Goldfields region of Western Australia, approximately 40 kilometers northwest of Leinster. Kalkine’s Low Carbon Research Report covers the Investment Highlights, Low Carbon Emission Initiatives, Key Financial Metrics, Risks, and Technical Analysis along with the Valuation, Target Price, and Recommendation on the stock.
Section 1.2: Why Low Carbon Emission Matters?
The shift toward a low-carbon economy is one of the most significant challenges of current time, spurred by the urgent need to combat climate change and reduce the environmental impact of corporate activities. This report covers the ASX-listed low-carbon emission company, Bellevue Gold Ltd (ASX: BGL), that is committed to sustainability and responsible environmental practices.
Carbon and Waste Management - Key Metrics
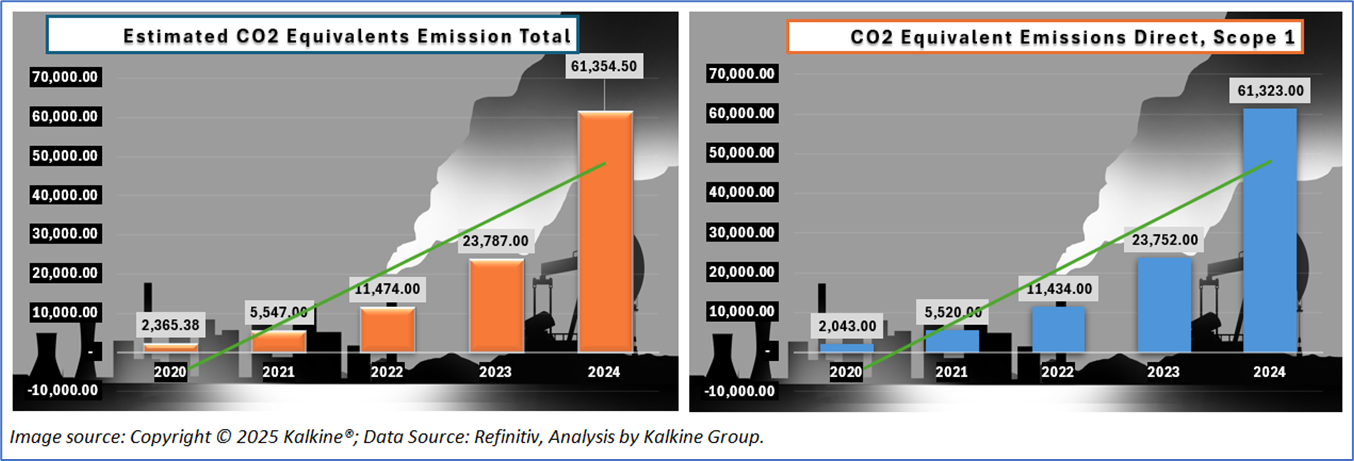
The image below highlights that BGL showed a sharp and consistent increase in both total CO2-equivalent emissions and Scope 1 direct emissions from 2020 to 2024. However, BGL moved from exploration → development → commissioning → full operational ramp-up.
When a mine transitions from planning to construction and production, energy usage, fuel consumption, machinery hours, and materials transport all rise significantly — which drives emissions up. By 2022, emissions increased as the mine entered development and infrastructure building, requiring diesel-powered machinery, drilling, blasting, and haulage. In 2023, emissions rose further with pre-production mining and commissioning activities. The increase in emissions is therefore correlated with increased operational activity, not ESG under-performance. From 2020–2021, emissions were low because BGL was mostly in pre-production and feasibility phases.
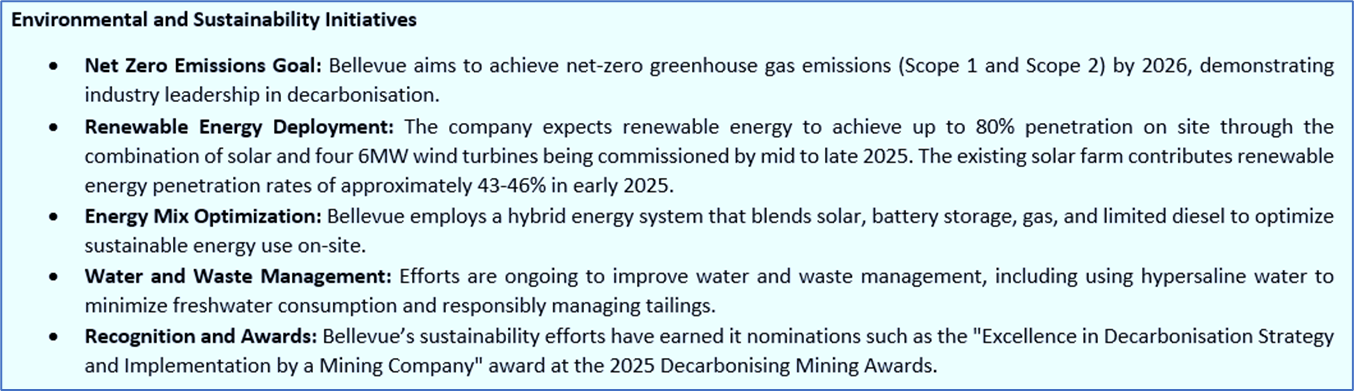
From the sustainability commitments outlined in the FY25 report, Bellevue plans to transition a majority of operational energy to renewable hybrid systems (wind + solar + battery). The mine has already incorporated energy efficiency programs. The company has stated plans to reduce emissions intensities measured per ounce of gold produced as operations stabilise.
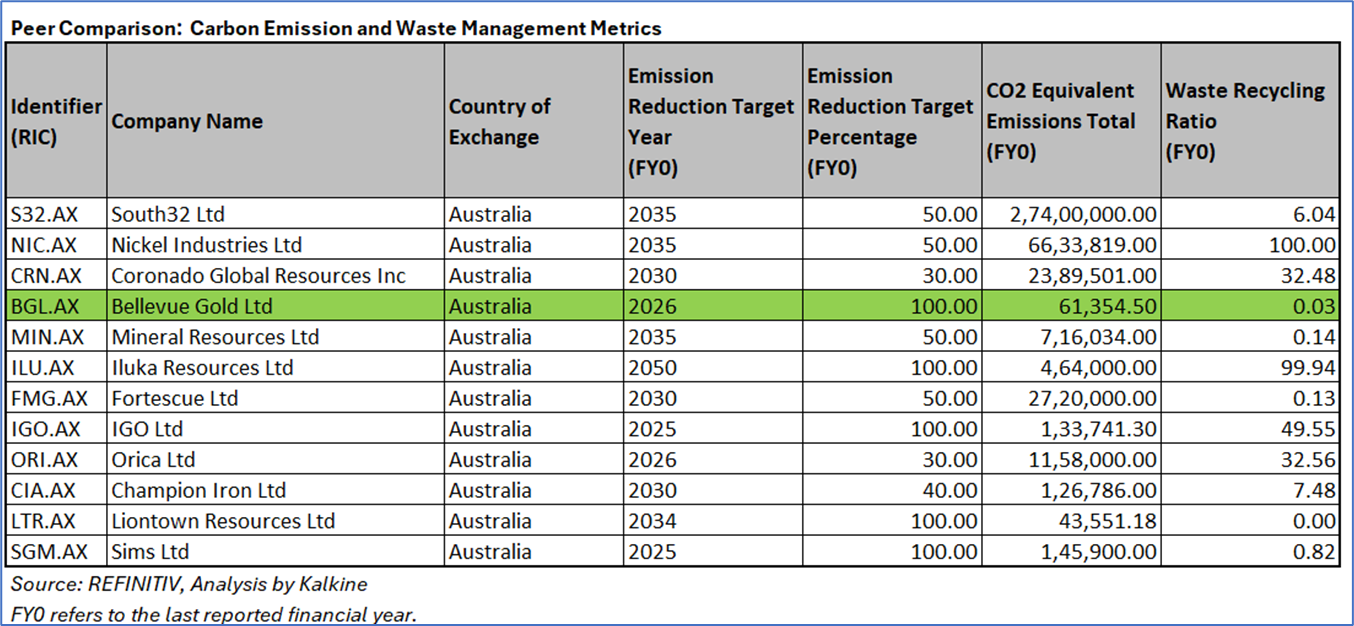
Peer Comparison: Carbon Emission and Waste Management Metrics
The peer comparison chart below highlighted that Bellevue Gold stands out in this peer set not because it currently has the lowest emissions, but because it demonstrates the most aggressive decarbonisation ambition among all ASX-listed mining peers shown. While many miners have set 2030–2050 net-zero or partial-reduction targets, BGL commits to 100% emission reduction by FY2026, which is dramatically earlier than the industry norm. Where Companies like South32, Mineral Resources, and Fortescue target 50% cuts by 2035 or 2030, BGL’s timeline is compressed into a near-term window — signaling both operational readiness and technological feasibility for rapid transition. Although BGL’s total emissions (~61,354 tonnes) exceed several established peers, this needs to be interpreted through lifecycle context: BGL is at the peak of its commissioning and ramp-up emissions phase. Mature operations like Iluka and Mineral Resources are already in production plateau stages, whereas Bellevue is just crossing into steady-state mining. The one area where BGL appears to lag is the waste recycling ratio (0.03%), which is materially lower than industry leaders such as Nickel Industries (100%), Iluka Resources (99.94%), and IGO Ltd (49.55%). This indicates that while BGL has prioritised decarbonisation as its primary ESG pillar, it is still in the early stages of developing circular-mining and waste-valorisation initiatives.
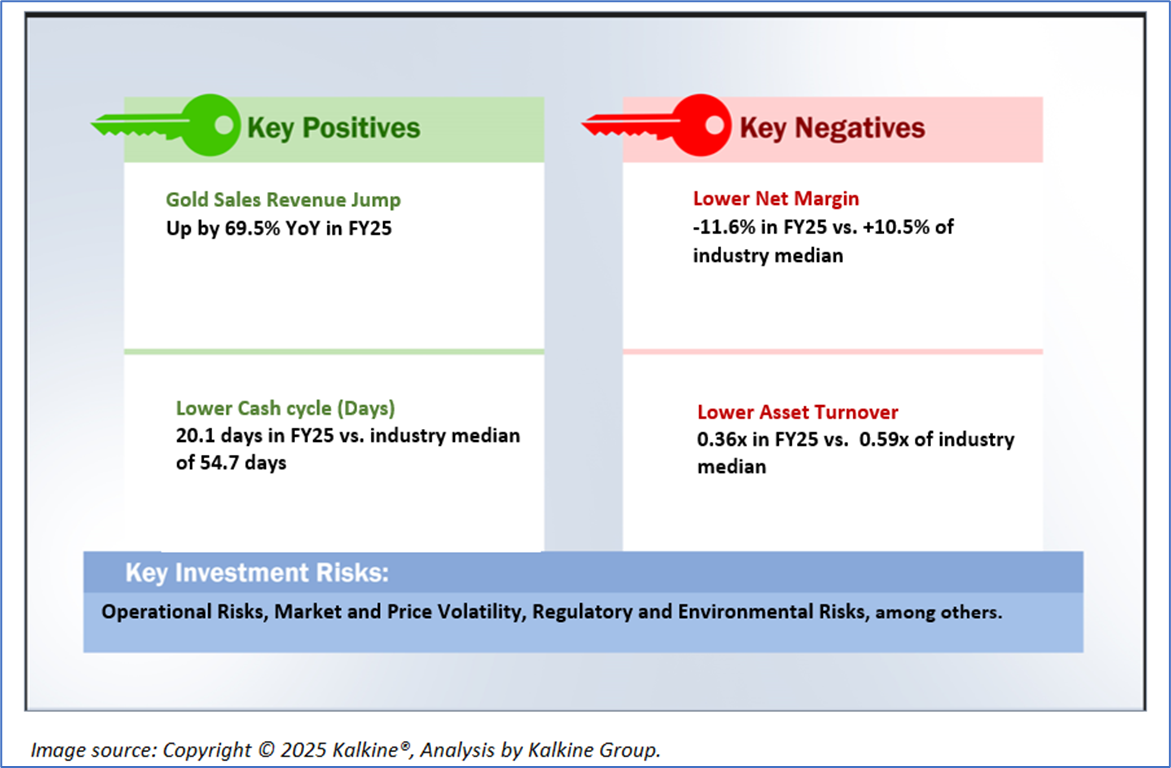
1.3 The Key Positives, Negatives, Key Risks, and Investment Highlights
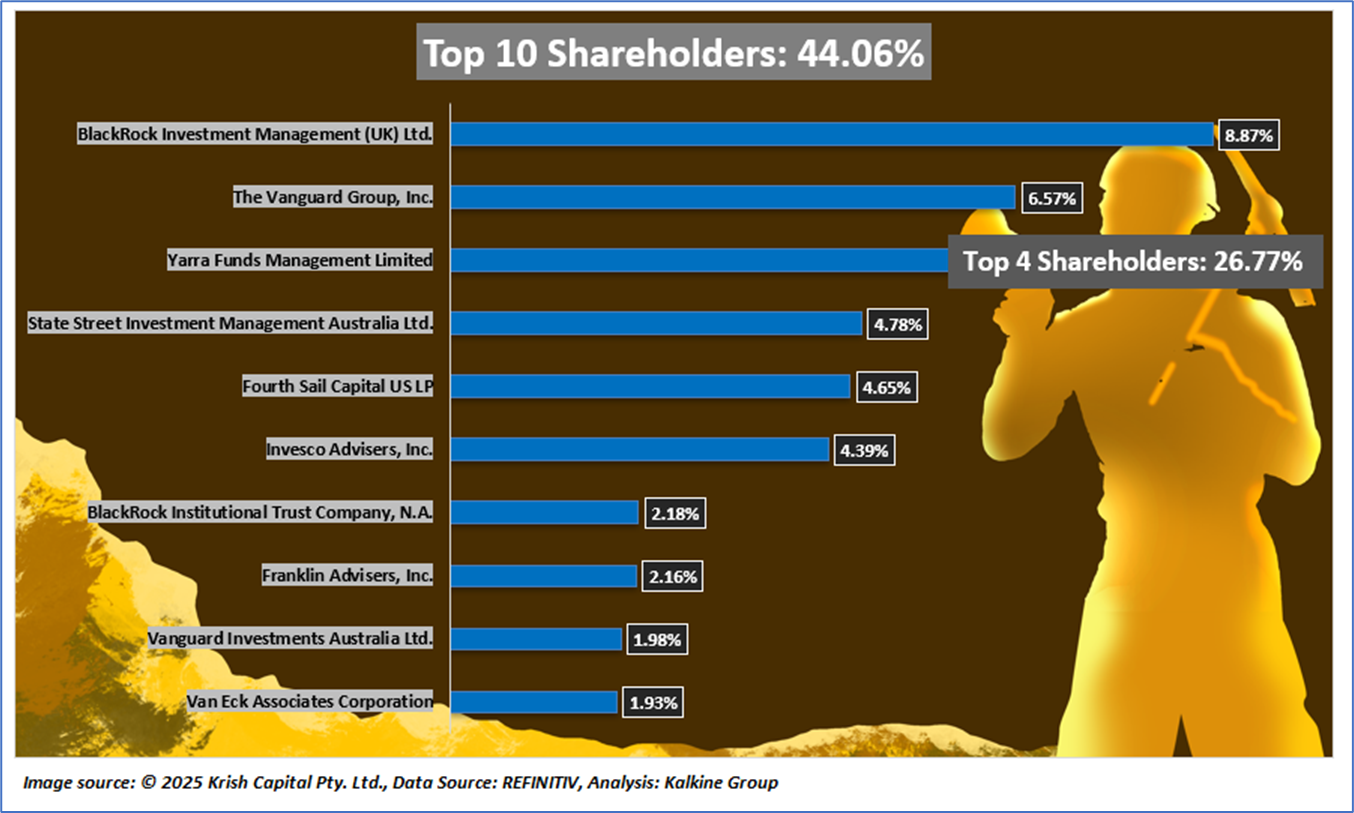
1.4 Top 10 Shareholders:
The top 10 shareholders together form ~44.06% of the total shareholding. BlackRock Investment Management (UK) Ltd. and The Vanguard Group, Inc. hold maximum stakes in the company at 8.87% and 6.57%, respectively.
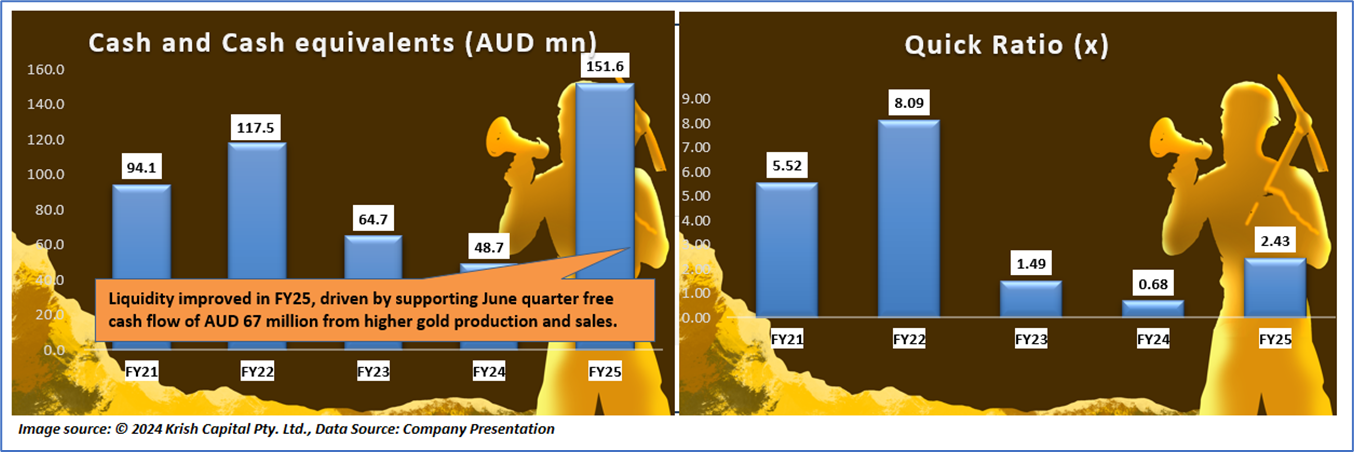
1.5 Key Metrics: The chart below highlights rising casbe rebuilt recovering quick ratio because it has transitioned from a capital‑intensive development and ramp‑up phase, where construction, underground development and working‑capital build drained earlier equity/financing cash and increased short‑term liabilities, into a cash‑generative production phase in FY25, with stronger gold output, lower unit costs and improved June quarter free cash flow allowing cash balances to rebuild and improving coverage of current liabilities as some payables and debt were paid down and hedge positions reduced.
Section 2: Business Updates, Financial and Operational Highlights
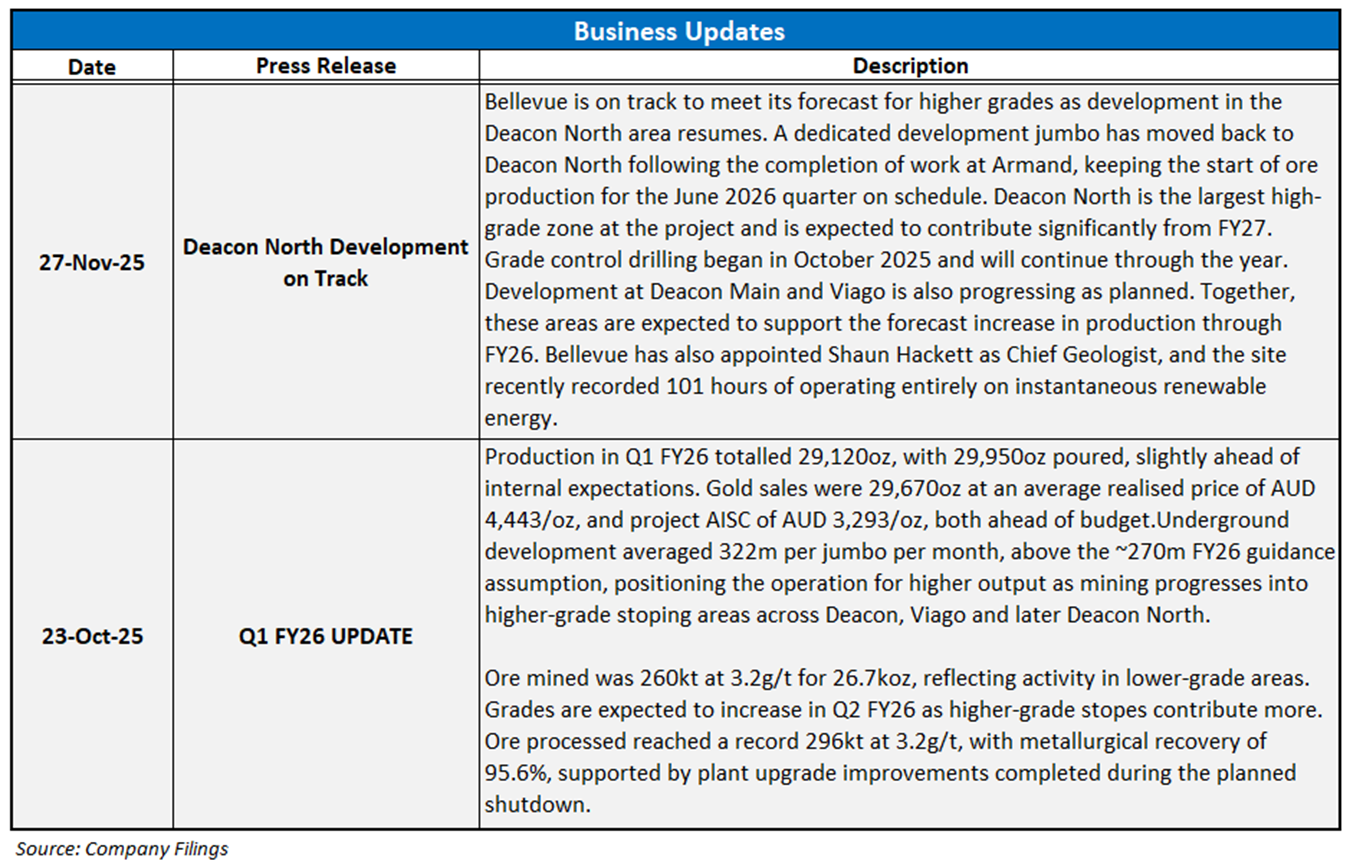
2.1 Recent Business Updates:
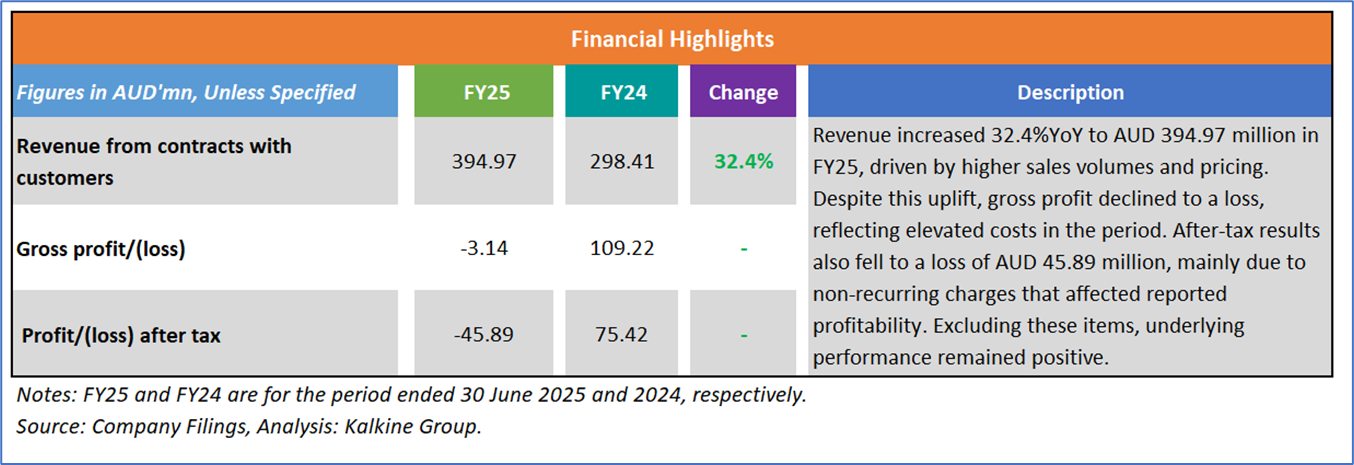
2.2 Results Highlights
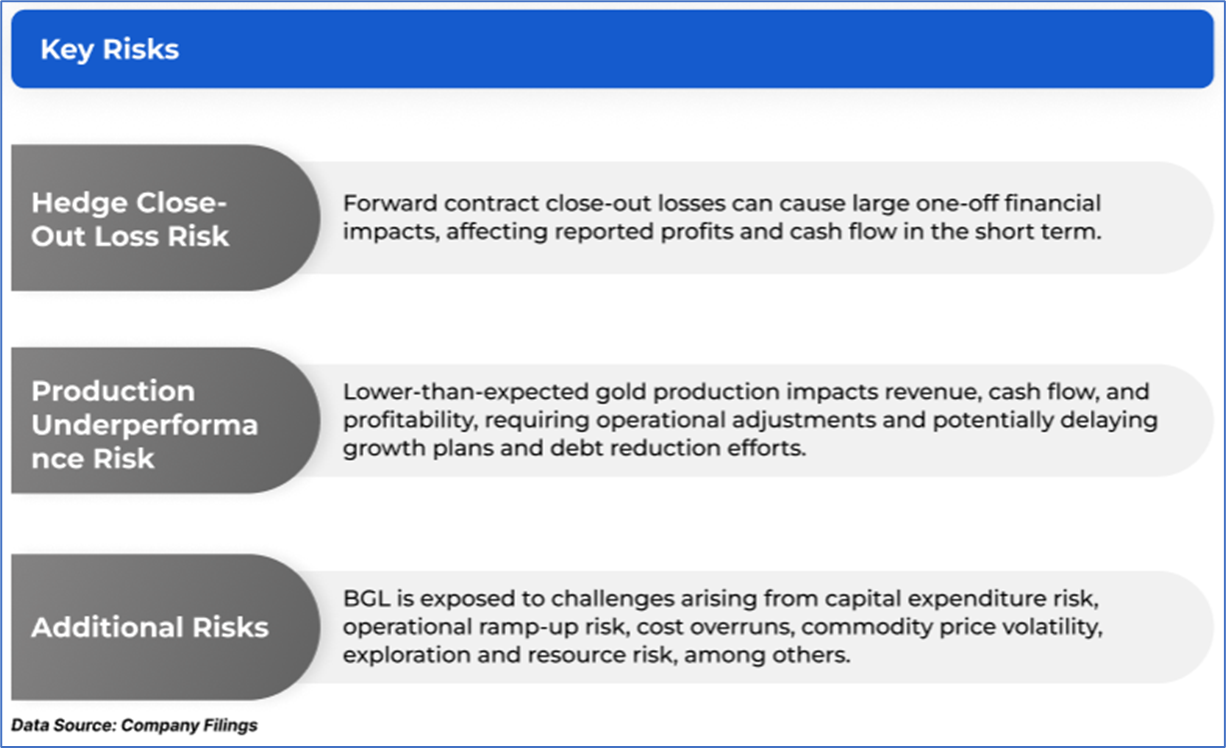
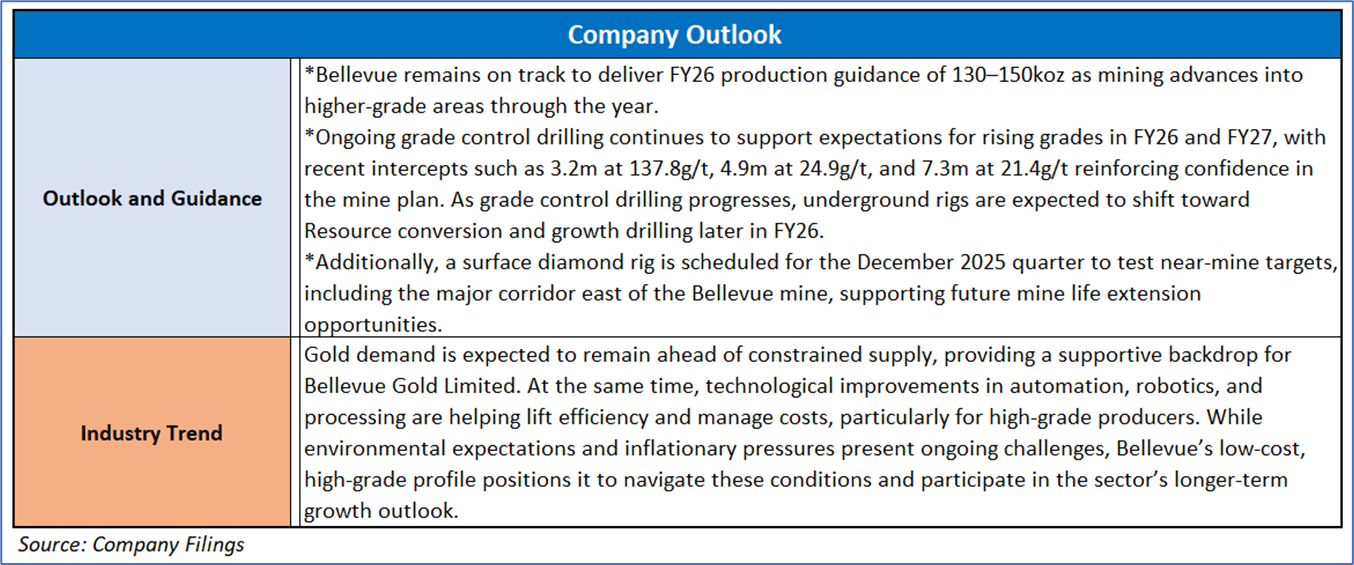
Section 3: Key Risks and Outlook:
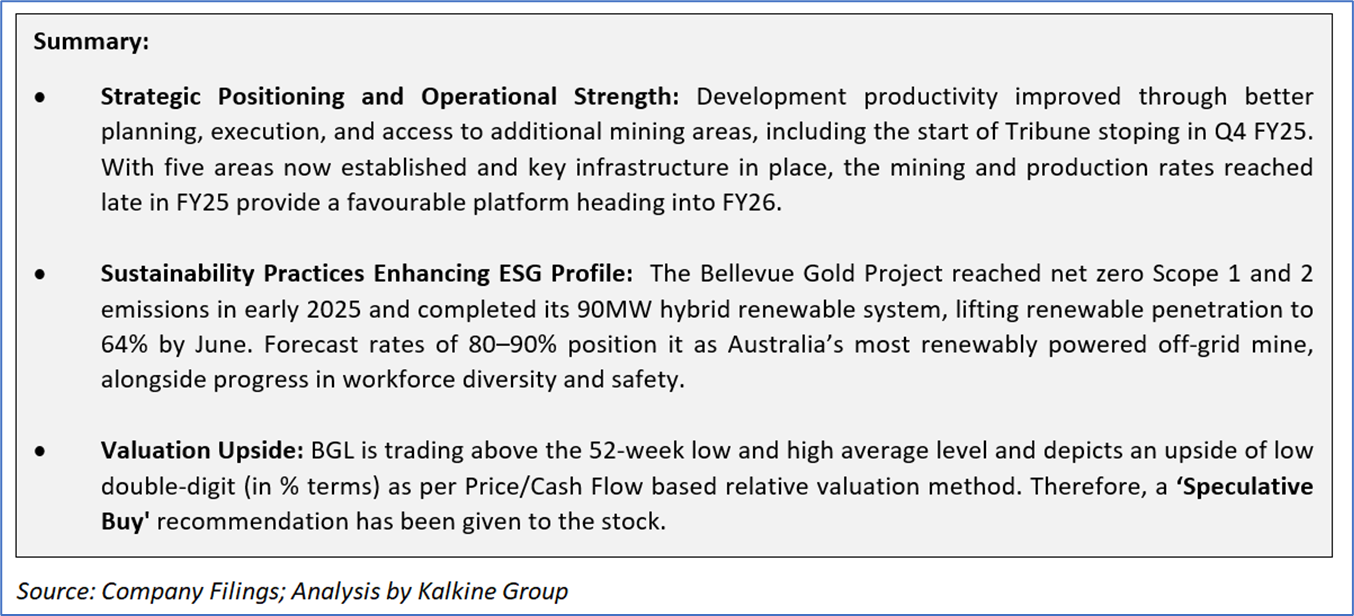
Section 4: Stock Recommendation Summary
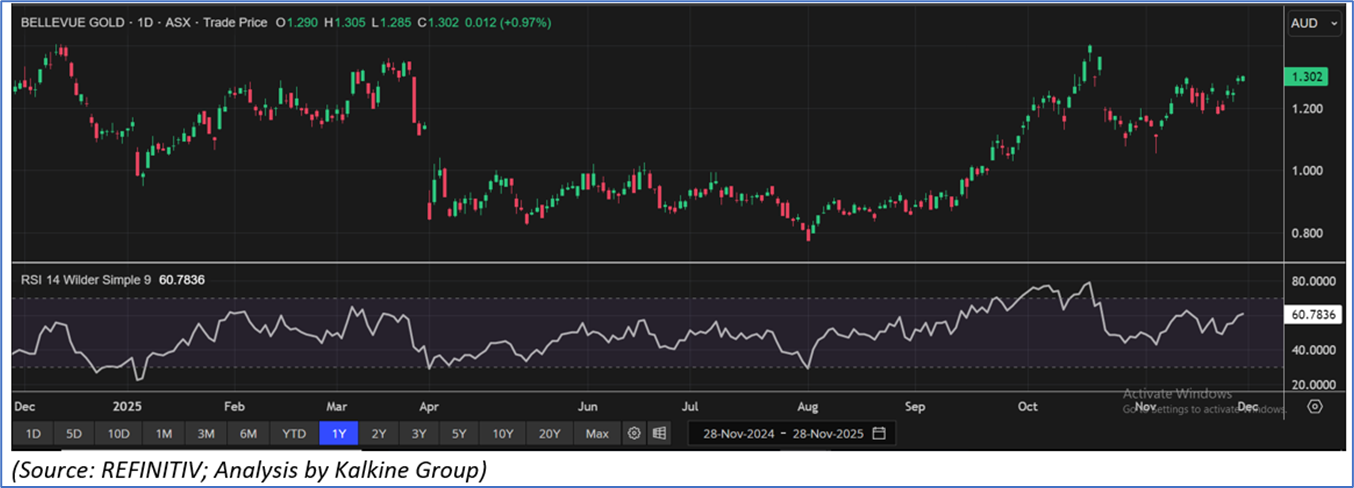
4.1 Price Performance and Technical Summary
The stock price has increased by ~16.25% in the last one month, and over the last six months, it has surged by ~37.05%. The stock has a 52-week low and 52-week high of AUD 0.775 and AUD 1.405, respectively. The stock is currently trading above the 52-week high and low average.
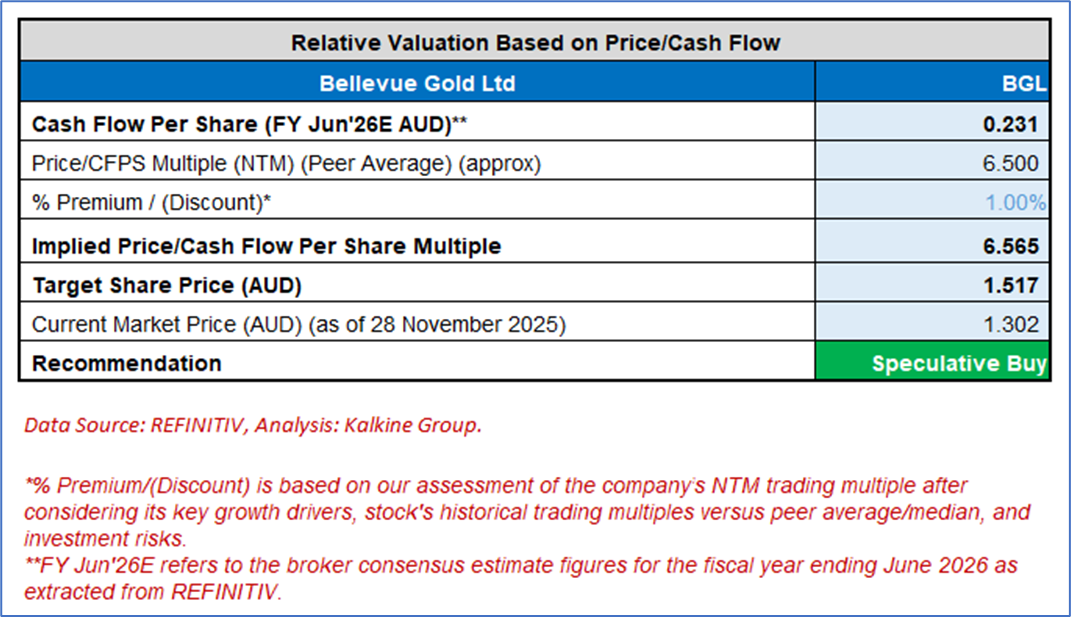
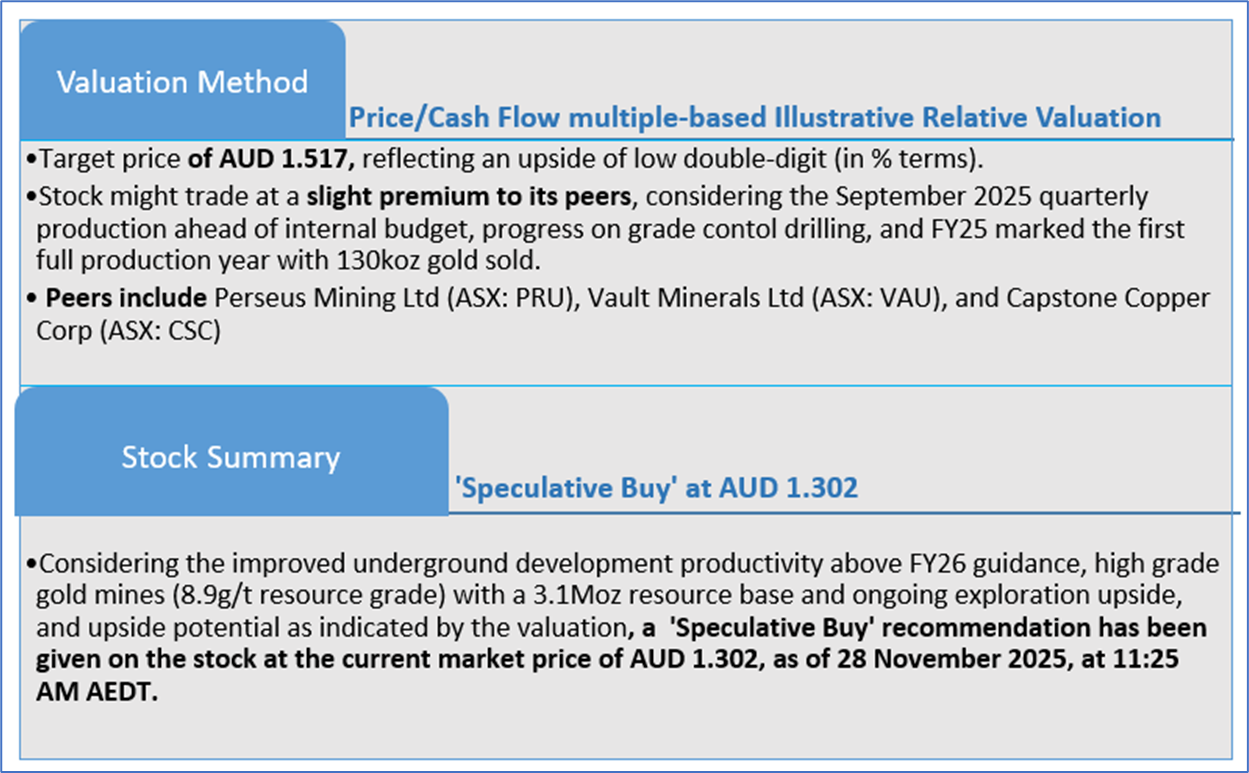
4.2 Fundamental Valuation
Valuation Methodology: Price/Cash Flow Multiple Based Relative Valuation (Illustrative)
Markets are trading in a highly volatile zone currently due to certain macro-economic issues and geopolitical tensions prevailing. Therefore, it is prudent to follow a cautious approach while investing.
Note 1: Past performance is neither an indicator nor a guarantee of future performance.
Note 2: The reference date for all price data, currency, technical indicators, support, and resistance levels is 28 November 2025. The reference data in this report has been partly sourced from REFINITIV.
Note 3: Investment decisions should be made depending on an individual's appetite for upside potential, risks, holding duration, and any previous holdings. An 'Exit' from the stock can be considered if the Target Price mentioned as per the Valuation and or the technical levels provided has been achieved and is subject to the factors discussed above.
Note 4: Dividend Yield may vary as per the stock price movement.
Note 5: Kalkine reports are prepared based on the stock prices captured either from REFINITIV or Trading View. Typically, REFINITIV or Trading View may reflect stock prices with a delay which could be a lag of 25-30 minutes. There can be no assurance that future results or events will be consistent with the information provided in the report. The information is subject to change without any prior notice.
Technical Indicators Defined: -
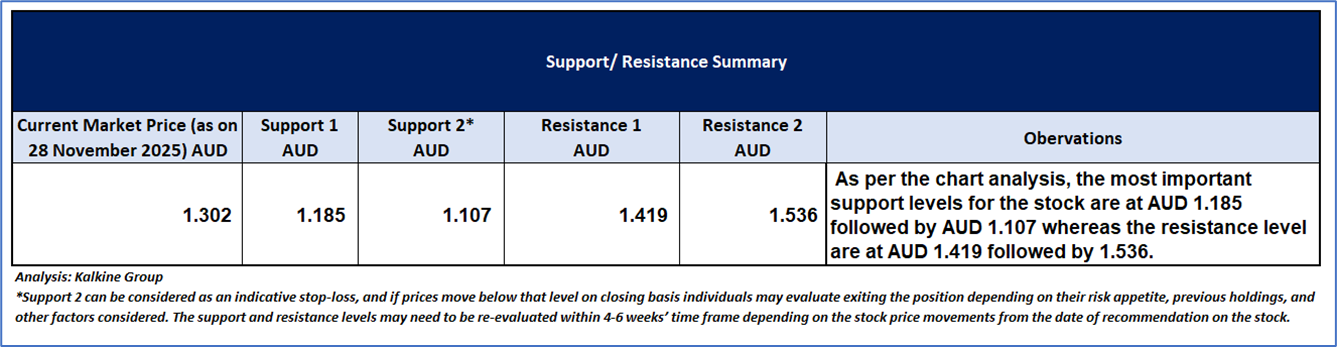
Support: A level at which the stock prices tend to find support if they are falling, and a downtrend may take a pause backed by demand or buying interest. Support 1 refers to the nearby support level for the stock and if the price breaches the level, then Support 2 may act as the crucial support level for the stock.
Resistance: A level at which the stock prices tend to find resistance when they are rising, and an uptrend may take a pause due to profit booking or selling interest. Resistance 1 refers to the nearby resistance level for the stock and if the price surpasses the level, then Resistance 2 may act as the crucial resistance level for the stock.
Stop-loss: It is a level to protect further losses in case of unfavourable movement in the stock prices.
This report (“Report”) has been issued by Kalkine New Zealand Limited (FSP691351) (NZBN:9429047678101) (“Kalkine”). Kalkine is a Financial Advice Provider (“FAP”) and is authorised by a Class 1 Financial Advice Provider Licence issued by Financial Markets Authority (“FMA”) to provide financial advice. Kalkine provides only general financial advice through its research reports following a person becoming a member. The reports contain buy/sell/hold and other recommendations in relation to equity securities, managed funds and other managed investment schemes and other financial advice products. The recommendations and opinions in this Report and on Kalkine website do not take into account any of your investment objectives, financial situation or needs. Before you make a decision about whether to acquire a financial product, you should obtain the Product Disclosure Statement from the product issuer. You should consider the appropriateness of advice taking into account your own objectives, financial situation and needs and seek independent financial advice before making any financial decisions. If you act on the advice in the research reports, you may have to pay fees, expenses or other amounts (but not to Kalkine).
The information in this Report and on the Kalkine website has been prepared from a wide variety of sources, which Kalkine, to the best of its knowledge and belief, considers accurate. Kalkine has made every effort to ensure the reliability of the information contained in its reports (including this Report), newsletters and websites. All information represents our views at the date of publication and may change without notice.
Kalkine does not issue, sell or deal in any financial products. The information in this Report does not constitute an offer to sell securities or other financial products or a solicitation of an offer to buy securities or other financial products. Our reports contain general recommendations to invest in securities and other financial products. Kalkine is not responsible for, and does not guarantee, the performance of, or returns on, any investments mentioned in this Report.
This Report may contain information on past performance of particular investments. Past performance is not a reliable indicator of future performance. Returns stated do not take into account transaction costs and taxes.
Further information about the complaints and dispute resolution process, as well as information about Kalkine’s duties are available on Kalkine’s website. Please read our Financial Advice Provider (FAP) disclosure statement and Complaints Handling Guide, which are available on the website.
Copyright 2025 Krish Capital Pty. Ltd. (ABN 61629651510). All Rights Reserved. No part of this Report, or its content, may be reproduced in any form without our prior consent.
Past performance is not a reliable indicator of future performance.
 Please wait processing your request...