One NYSE- Listed Personal Care Stock Under Radar - BBWI
Section 1: Company Overview and Fundamentals
1.1 Company Overview:
Bath & Body Works, Inc. (NYSE: BBWI) is a prominent American retailer specializing in personal care products, including body lotions, perfumes, candles, and home fragrances. Established in 1990 and headquartered in Columbus, Ohio, the company is widely recognized for its unique product offerings, innovative marketing strategies, and engaging in-store experiences. Bath & Body Works operates both physical retail locations and an e-commerce platform, catering to a diverse consumer base.
Kalkine’s Dividend Income Report covers the Company Overview, Key positives & negatives, Investment summary, Key investment metrics, Top 10 shareholding, Business updates and insights into company recent financial results, Key Risks & Outlook, Price performance and technical summary, Target Price, and Recommendation on the stock.
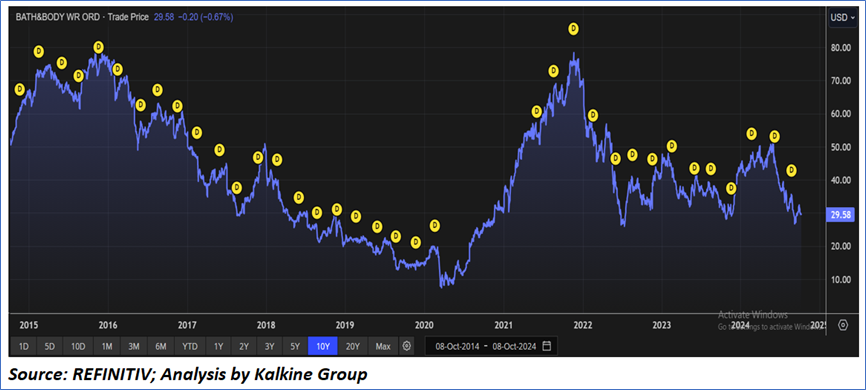
Price Performance:
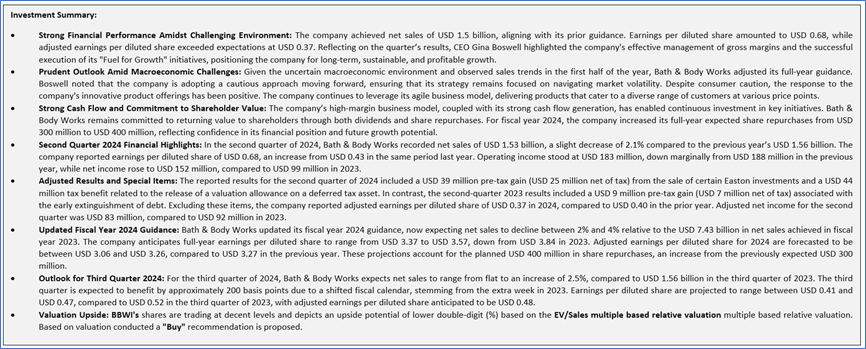
1.2 The Key Positives, Negatives, and Investment summary

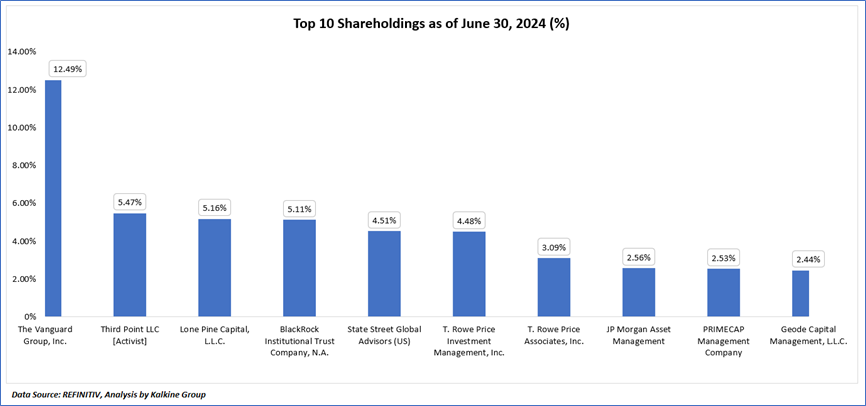
1.3 Top 10 shareholders:
The top 10 shareholders together form ~47.84% of the total shareholding, signifying diverse shareholding. The Vanguard Group, Inc., and Third Point LLC [Activist], are the biggest shareholders, holding the maximum stake in the company at ~12.49% and ~5.47%, respectively.
1.4 Dividend payments with impressive dividend yield:
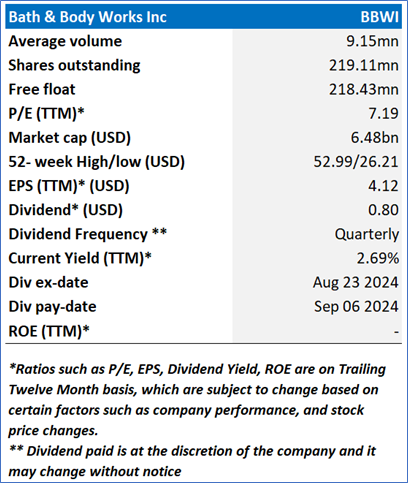
Bath & Body Works, Inc. (NYSE: BBWI) has established a robust history of returning value to shareholders through consistent dividend distributions. Following its separation from L Brands, the company initiated its dividend policy with the first declaration shortly after its IPO in August 2021, and it has generally maintained quarterly payments at a rate of USD 0.15 per share, with a focus on sustainable growth. Recently, Bath & Body Works announced the declaration of its regular quarterly dividend of USD 0.20 per share, payable on September 6, 2024, to shareholders of record at the close of business on August 23, 2024. The company is committed to increasing its dividend payouts over time, reflecting its operational performance and cash flow generation while balancing reinvestment in growth opportunities.
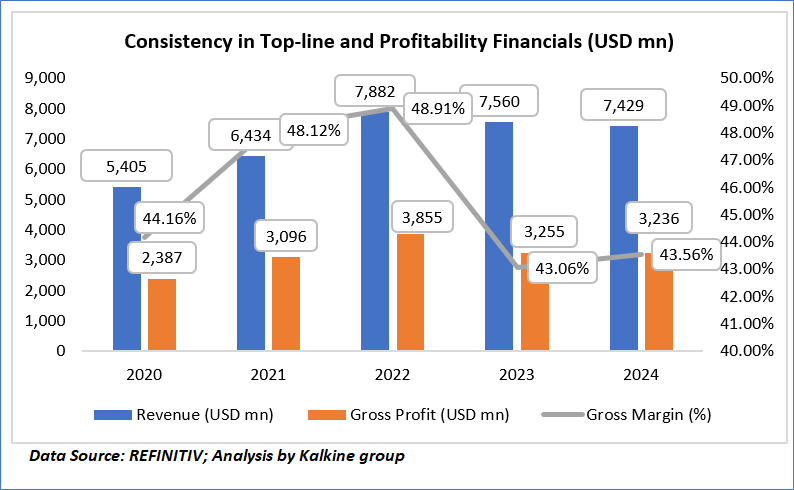
1.5 Key Metrics
Bath & Body Works, Inc. (BBWI) has demonstrated a fluctuating revenue and gross profit trajectory from 2020 to 2024. In 2020, the company reported a revenue of USD 5.41 billion, which increased to USD 6.43 billion in 2021, and further rose to USD 7.88 billion in 2022. However, revenues slightly decreased to USD 7.56 billion in 2023 and are projected to decline further to USD 7.43 billion in 2024. Gross profit has followed a similar pattern, starting at USD 2.39 billion in 2020, increasing to USD 3.10 billion in 2021, and reaching USD 3.86 billion in 2022, before dropping to USD 3.26 billion in 2023 and slightly recovering to USD 3.24 billion in 2024. The gross margin percentage peaked at 48.91% in 2022 but has since contracted, recorded at 43.06% in 2023 and anticipated to be 43.56% in 2024.
Section 2: Business Updates and Financial Highlights
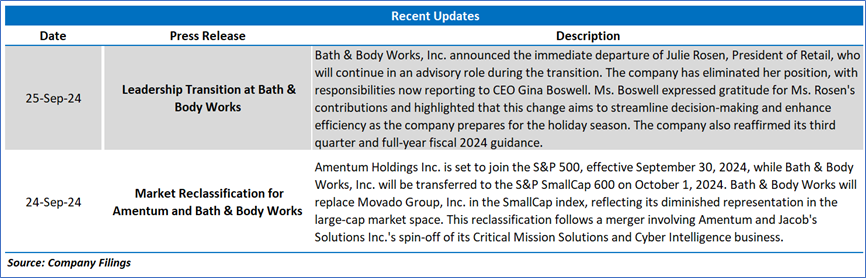
2.1 Recent Updates:
The below picture gives an overview of the recent updates:
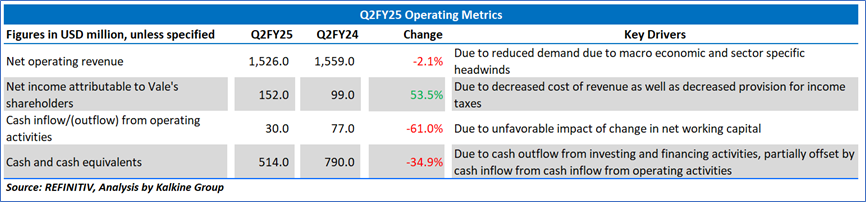
2.2 Insights of Q2FY25:
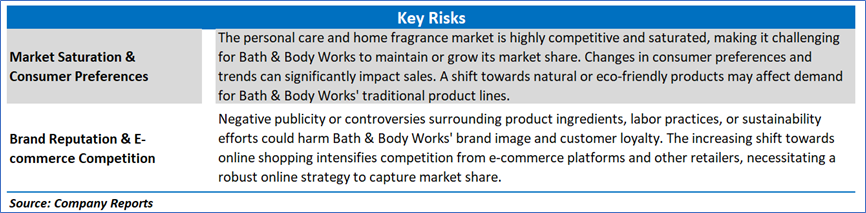
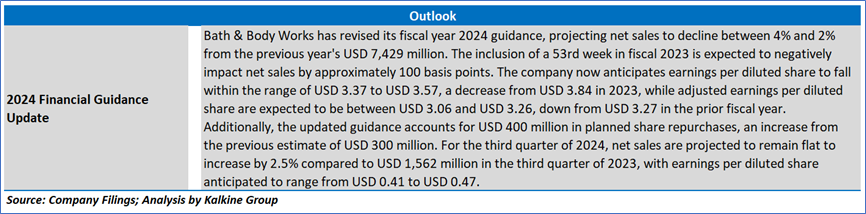
Section 3: Key Risks and Outlook:
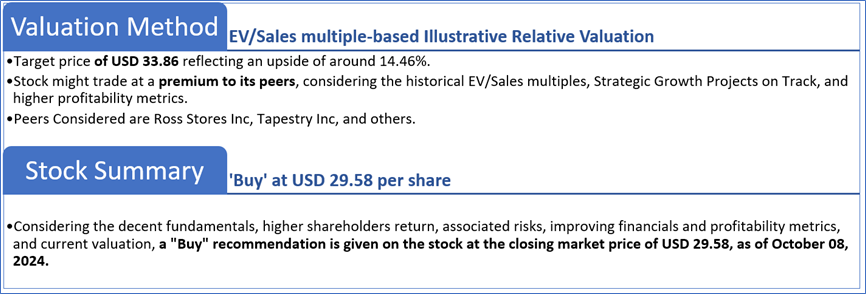
Section 4: Stock Recommendation Summary:
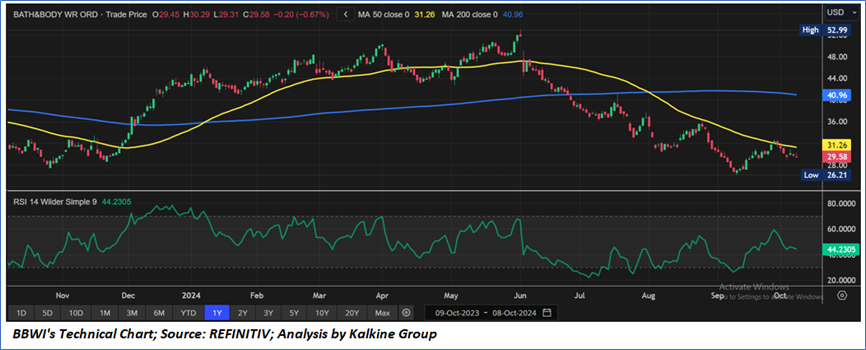
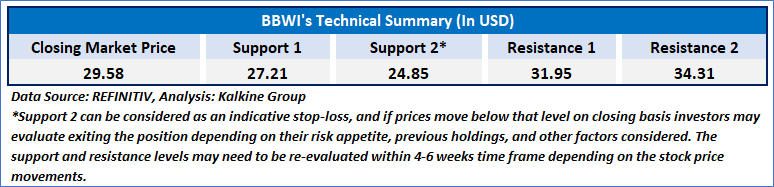
4.1 Technical Summary:
Price Performance:
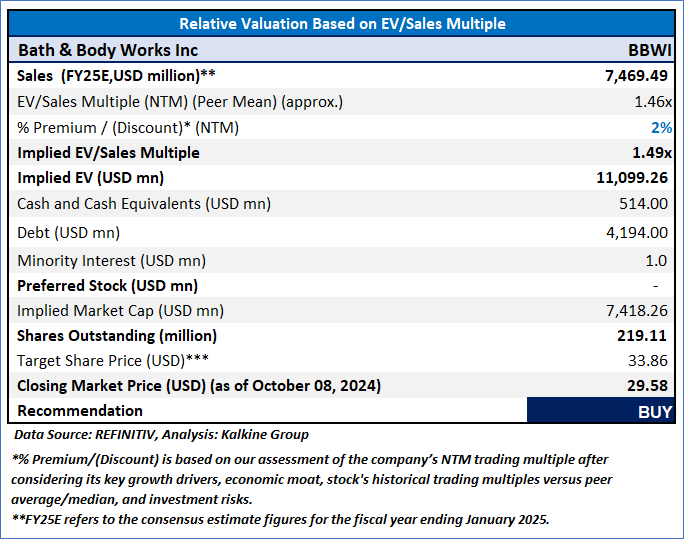
4.2 Fundamental Valuation
Valuation Methodology: Price/Earnings Per Share Multiple Based Relative Valuation
Markets are trading in a highly volatile zone currently due to certain macroeconomic issues and geopolitical tensions prevailing. Therefore, it is prudent to follow a cautious approach while investing.
Note 1: Past performance is not a reliable indicator of future performance.
Note 2: The reference date for all price data, currency, technical indicators, support, and resistance levels is October 08, 2024. The reference data in this report has been partly sourced from REFINITIV.
Note 3: Investment decisions should be made depending on an individual's appetite for upside potential, risks, holding duration, and any previous holdings. An 'Exit' from the stock can be considered if the Target Price mentioned as per the Valuation and or the technical levels provided has been achieved and is subject to the factors discussed above.
Note 4: The report publishing date is as per the Pacific Time Zone.
Technical Indicators Defined: -
Support: A level at which the stock prices tend to find support if they are falling, and a downtrend may take a pause backed by demand or buying interest. Support 1 refers to the nearby support level for the stock and if the price breaches the level, then Support 2 may act as the crucial support level for the stock.
Resistance: A level at which the stock prices tend to find resistance when they are rising, and an uptrend may take a pause due to profit booking or selling interest. Resistance 1 refers to the nearby resistance level for the stock and if the price surpasses the level, then Resistance 2 may act as the crucial resistance level for the stock.
Stop-loss: It is a level to protect against further losses in case of unfavorable movement in the stock prices.
Disclaimer This report has been issued by Kalkine New Zealand Limited (FSP691351) (NZBN:9429047678101) (“Kalkine”). Kalkine is a Financial Advice Provider (“FAP”) and is authorised by a Class 1 Financial Advice Provider Licence issued by Financial Markets Authority (“FMA”) to provide financial advice. Kalkine provides only general financial advice through its research reports following a person becoming a member. The reports contain buy/sell/hold and other recommendations in relation to equity securities, managed funds and other managed investment schemes and other financial advice products. The recommendations and opinions in this report and on Kalkine website do not take into account any of your investment objectives, financial situation or needs. Before you make a decision about whether to acquire a financial product, you should obtain the Product Disclosure Statement from the product issuer. You should consider the appropriateness of advice taking into account your own objectives, financial situation and needs and seek independent financial advice before making any financial decisions. If you act on the advice in the research reports, you may have to pay fees, expenses or other amounts (but not to Kalkine). Further information about the complaints and dispute resolution process, as well as information about Kalkine’s duties are available on Kalkine’s website. Please read our Financial Advice Provider (FAP) disclosure statement and Complaints Handling Guide, which are available on the website.
Past performance is not a reliable indicator of future performance.
 Please wait processing your request...