

Kalkine’s Global Tariff Report delivers objective, data-driven insights into key global sectors impacted by tariff fluctuations. It assesses how these changes influence equity valuations across affected industries, with a focus on trade-sensitive sectors that often attract increased investor attention during times of tariff-related uncertainty. The report also highlights defensive and countercyclical segments that tend to show resilience—or even outperformance—amid disruptions in global trade dynamics.
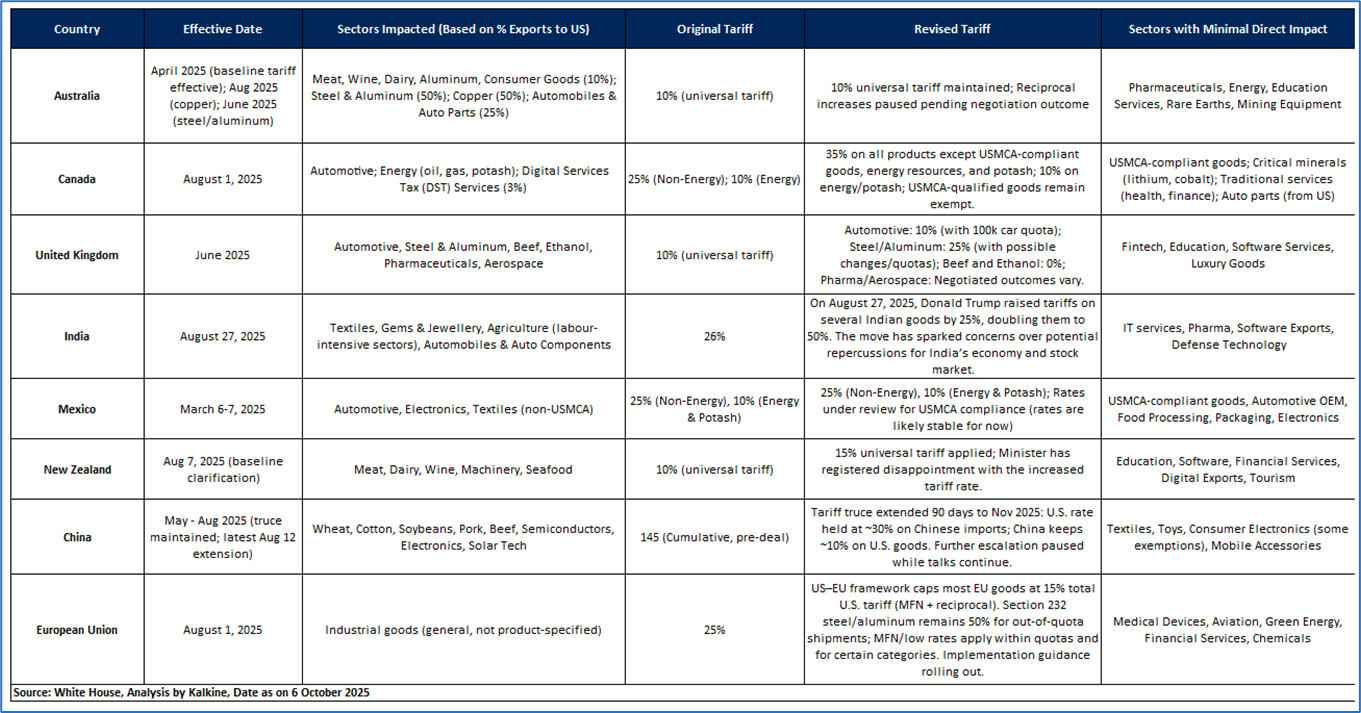
As illustrated in the table below, several key sectors in different countries are directly impacted by the recent tariff announcement from President Trump.
Key Highlights
Latest Key Developments (as of 6 October 2025)
Key Highlights of the Proclamation on Wood Product Tariffs
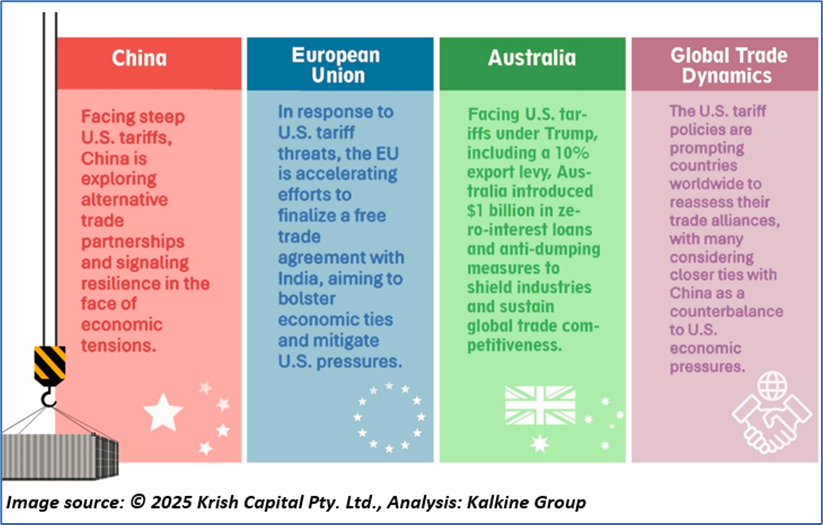
Global Implications of Tariffs

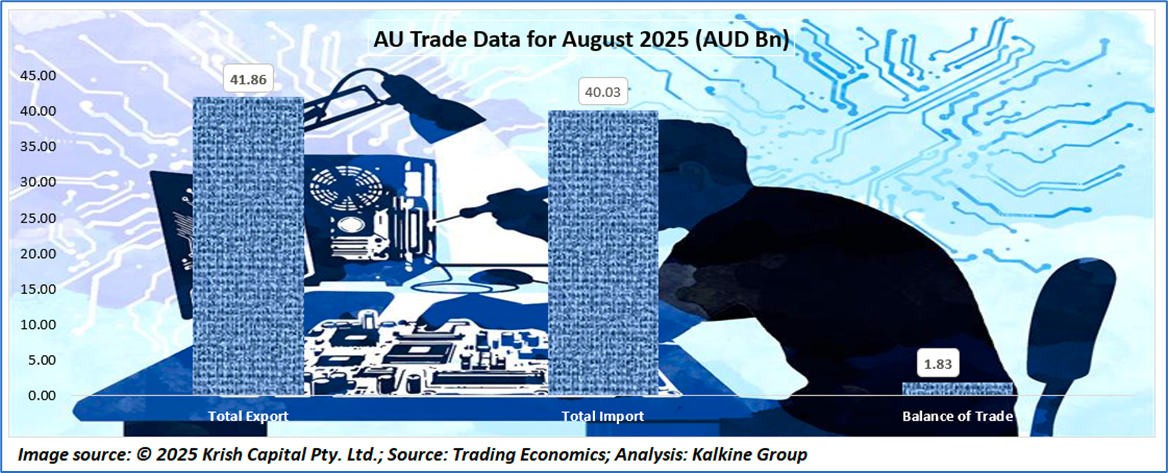
Australia’s external sector data for mid-2025 reflected mixed trends. The balance of trade narrowed sharply to AUD 1,825 million in August 2025 from AUD 6,612 million previously, as exports fell to AUD 41,858 million while imports rose to AUD 40,033 million. The current account deficit eased slightly to AUD 13,654 million in June 2025. External debt stood at AUD 2.68 trillion, while the terms of trade index weakened to 114 from 119, indicating softer export prices. Capital inflows increased to AUD 17,669 million, supported by higher foreign direct investment, which surged to AUD 81 billion in December 2024. Meanwhile, tourist arrivals rose to 743,210 in July 2025, signaling continued recovery in travel activity.

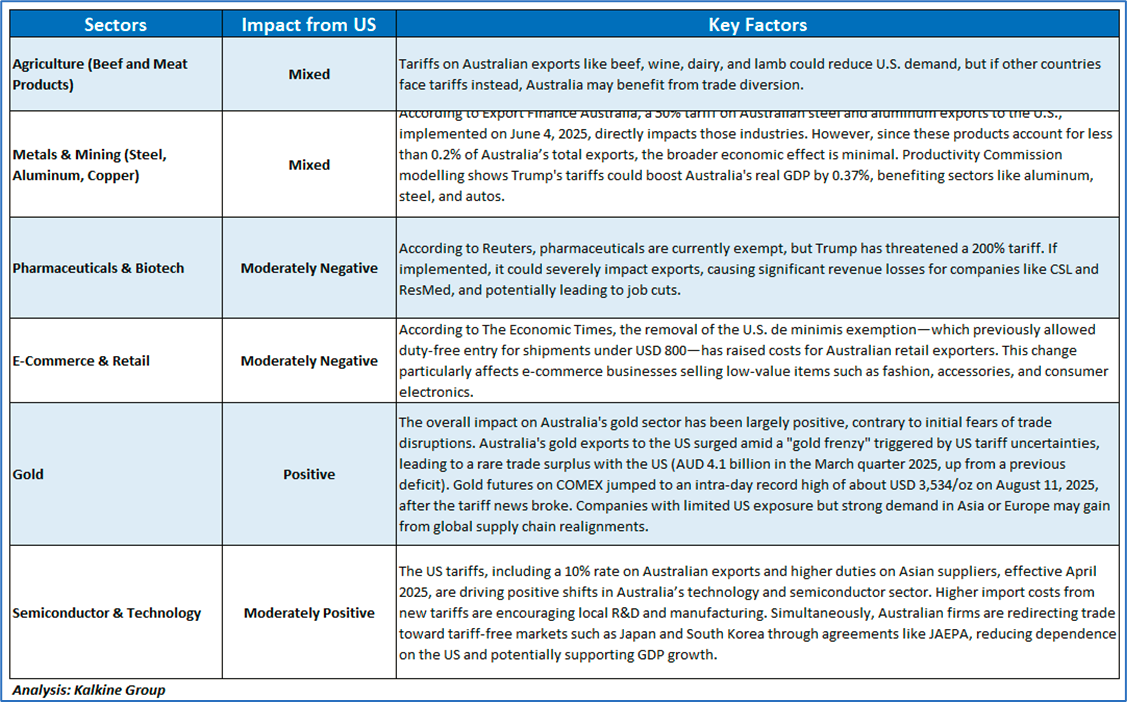

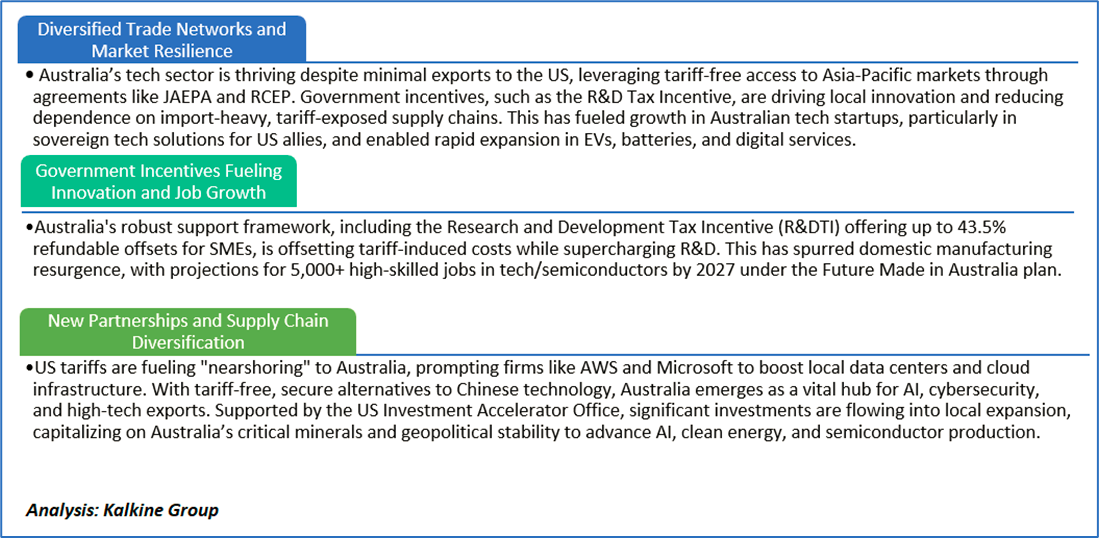
Amid the US's 10% baseline tariffs on Australian exports (effective April 2025) and steeper duties on key suppliers like China (34%) and Vietnam (46%), Australia's AUD 167 billion technology sector—encompassing semiconductors, software, cybersecurity, and digital services—stands out as a resilient investment hub. Far from being deterred, these trade frictions are amplifying Australia's appeal through strategic advantages, policy tailwinds, and diversification plays. Below are several key reasons why technology sector remains attractive despite U.S. tariff concerns:
Amid elevated Market Volatility and Tariff pressures, EROAD Limited (ASX: ERD) stands out as a defensive pick within the technology sector, supported by rigorous fundamental and technical research
Section 1: Company Overview and Fundamentals Insights
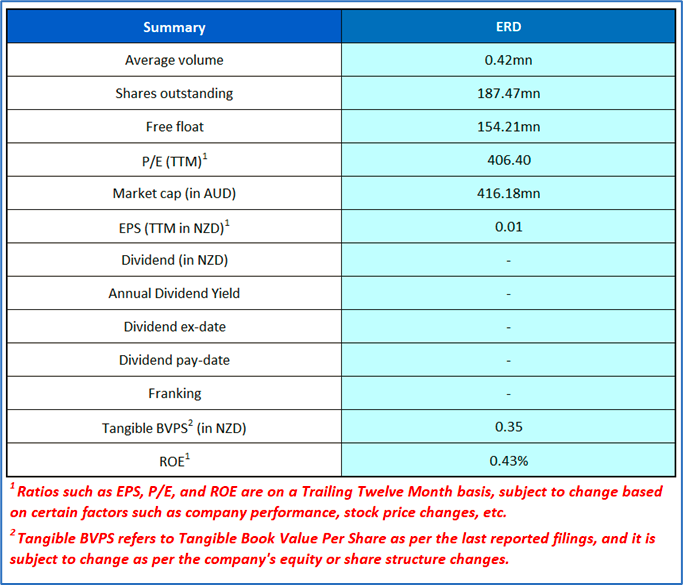
Company Overview: EROAD Limited (ASX: ERD) is a technology-driven provider of tolling and fleet management solutions for the transport industry. It offers electronic on-board units and SaaS-based platforms across New Zealand, Australia, and North America. Kalkine’s Global Tariff Report covers the Investment Highlights, Key Financial Metrics, Risks, and Technical Analysis along with the Valuation, Target Price, and Recommendation on the stock.
1.2 The Key Positives, Negatives, Investment Highlights, and Risks

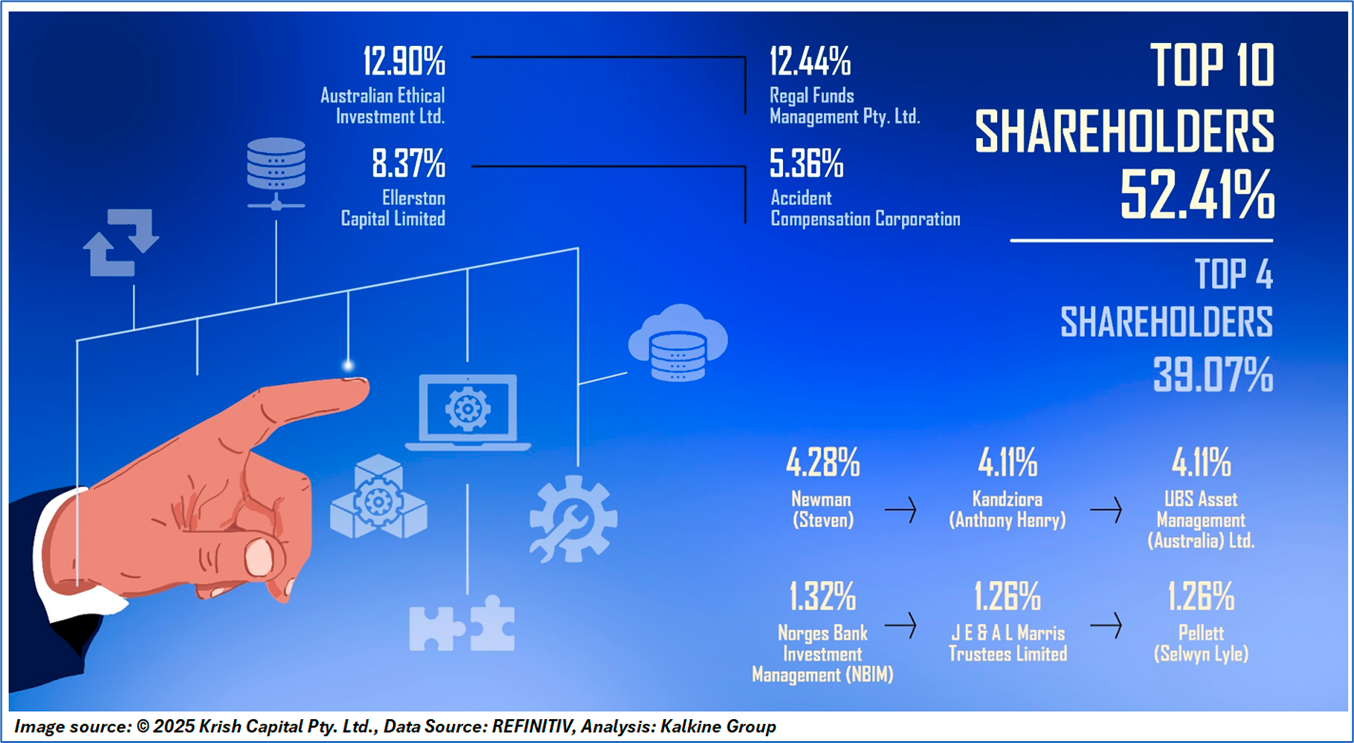
1.3 Top 10 Shareholders:
The top 10 shareholders together form ~52.41% of the total shareholding. Australian Ethical Investment Ltd., and Regal Funds Management Pty. Ltd. hold maximum stakes of 12.90% and 12.44%, respectively.
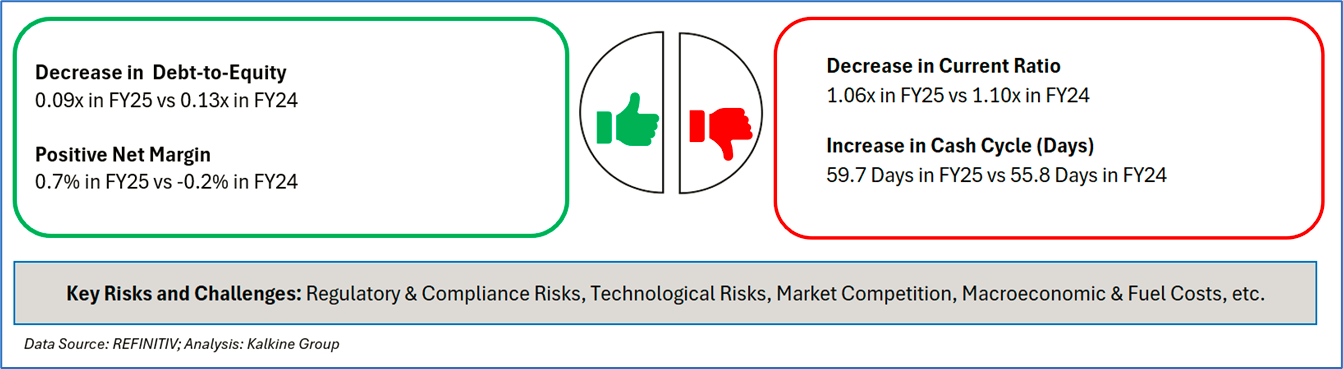
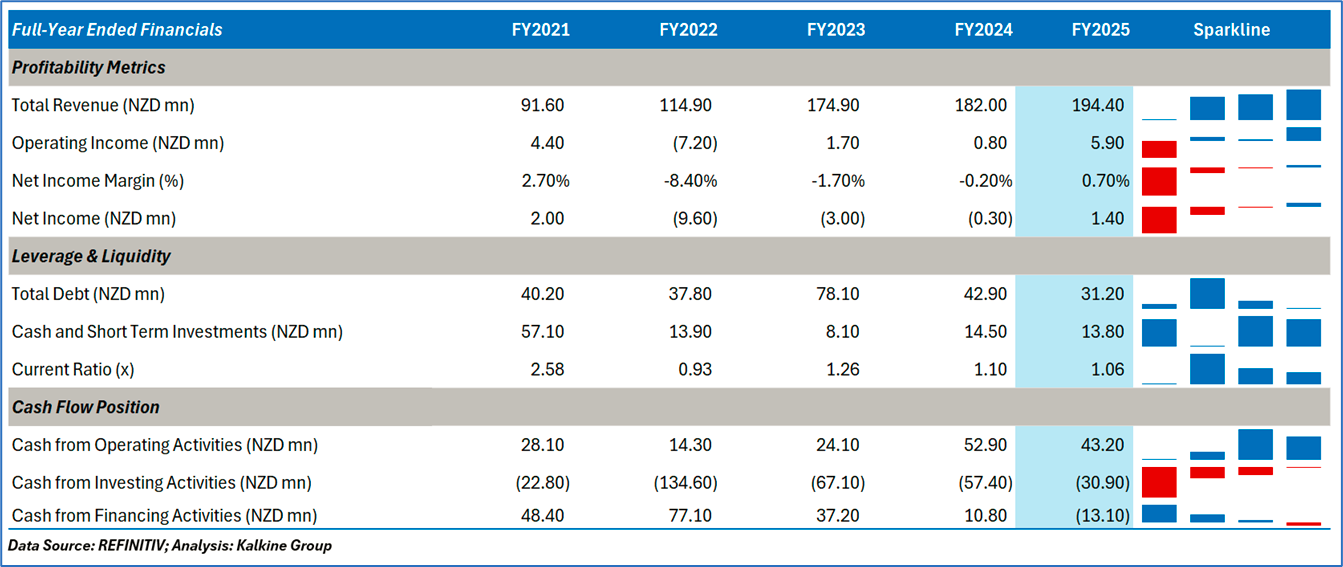
1.4 Key Metrics: ERD’s debt-to-equity decreased to 0.09x in FY25 compared to 0.13x in FY24. Below is captured other metrics:
Section 2: Business Updates, Financial and Operational Highlights
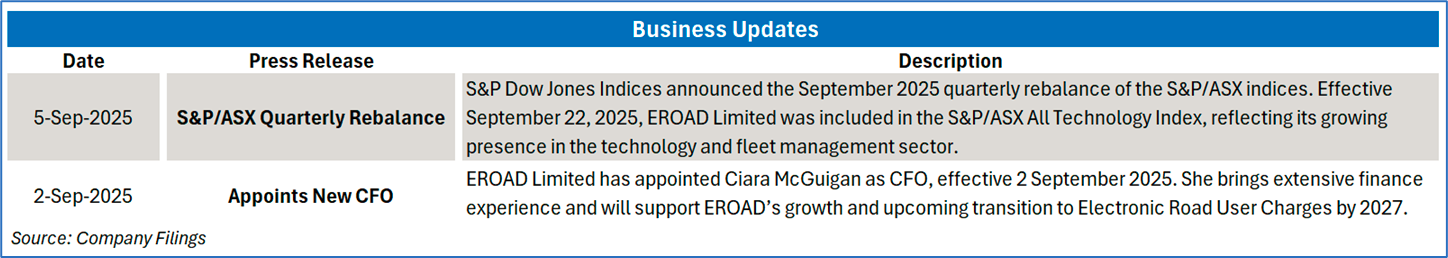
2.1 Recent Business Updates:
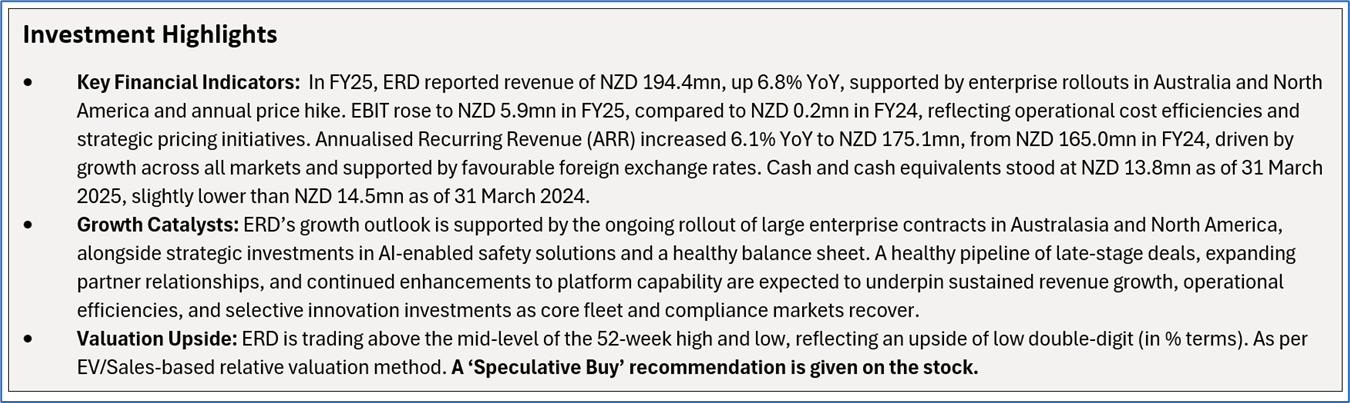
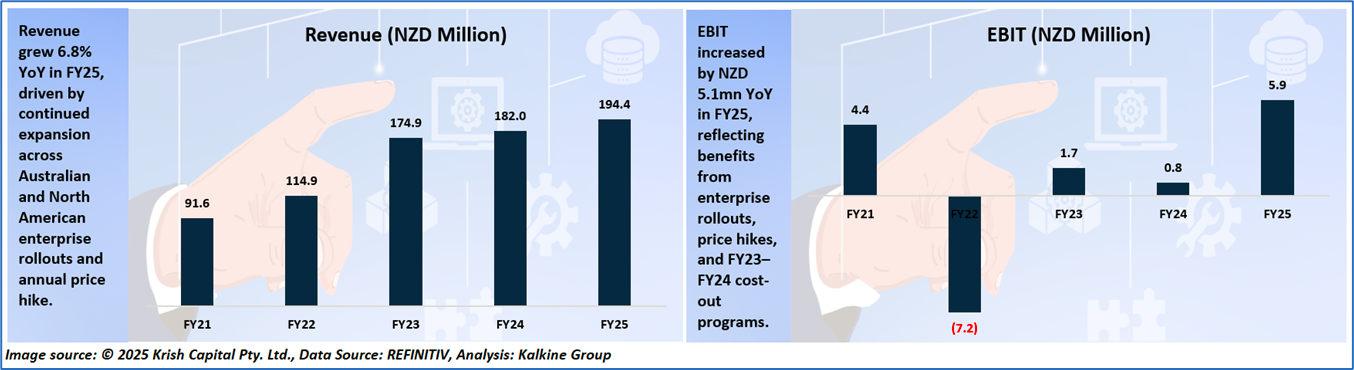
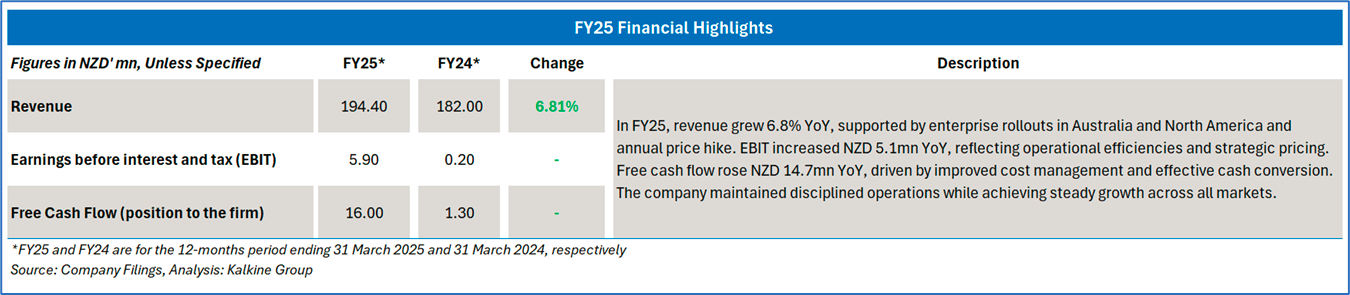
2.2 FY25 Results Highlights (for the 12 months ended 31 March 2025): Below mentioned are some key financial highlights:
2.3 Historical Financial Trend
Section 3: Key Risks and Outlook:
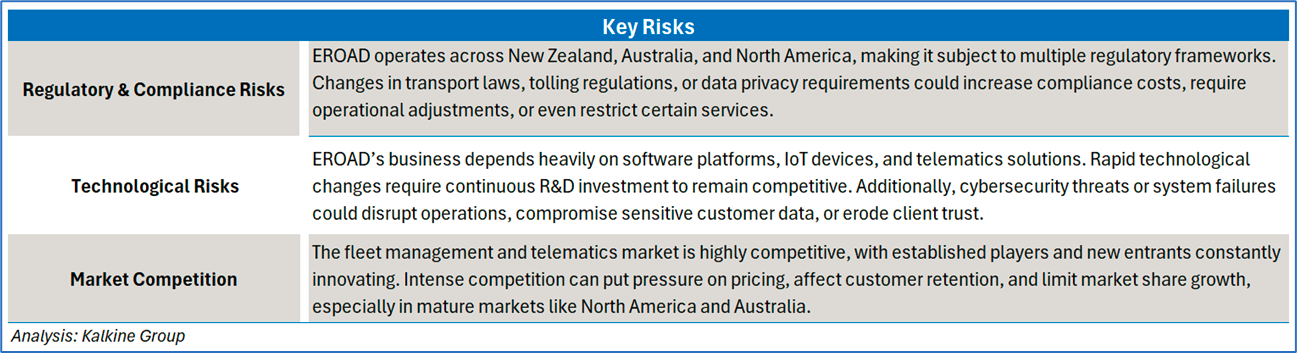
(92)_10_06_2025_09_13_50_079450.jpg)
Section 4: Stock Recommendation Summary
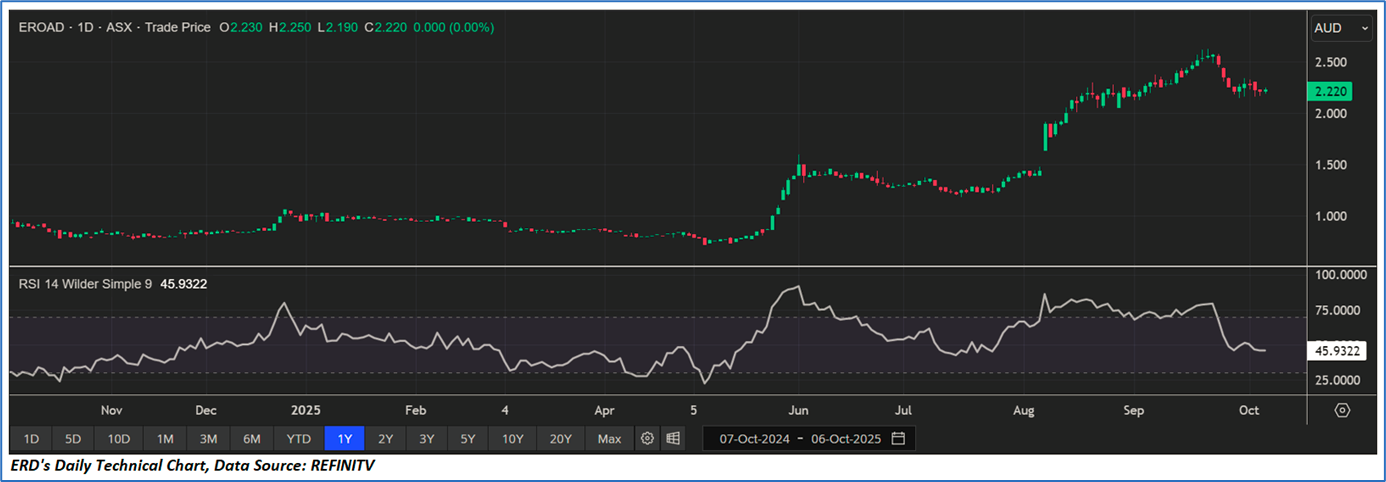
4.1 Price Performance and Technical Summary
The stock has decreased by ~3.06% in the last one month, and over the past three months, stock has increased by ~65.67%. The stock has a 52-week low and 52-week high of AUD 0.725 and AUD 2.630, respectively, and is currently trading above the 52-week high-low average.
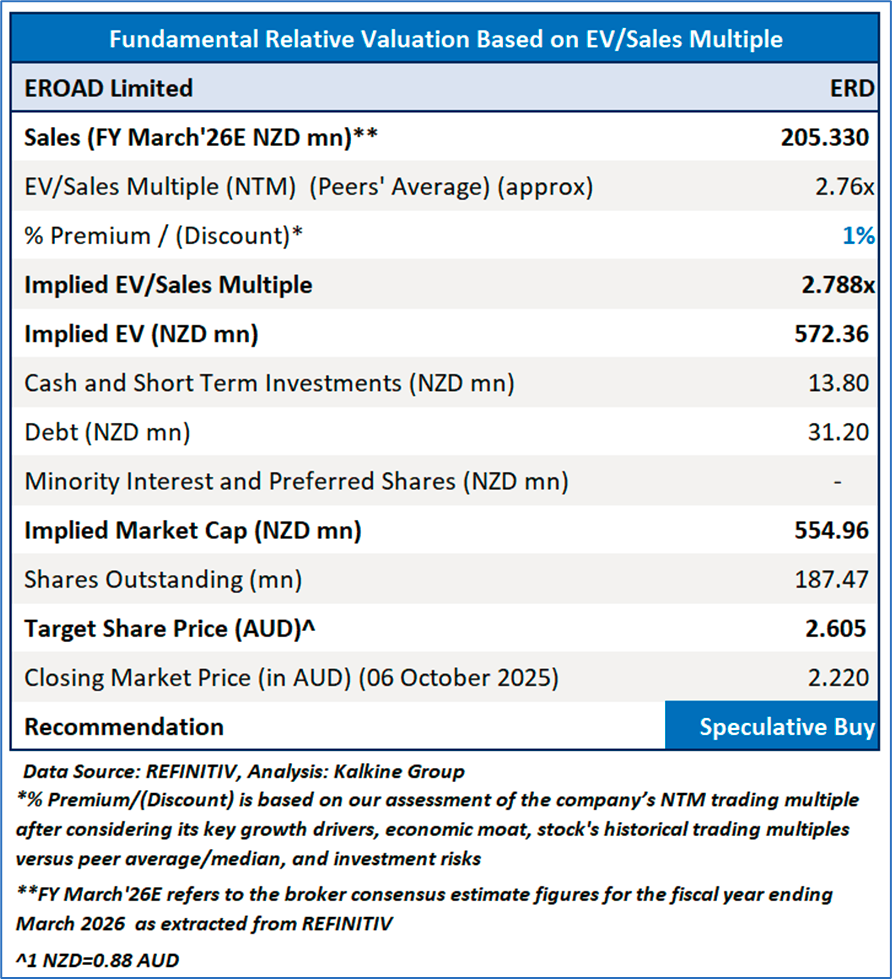
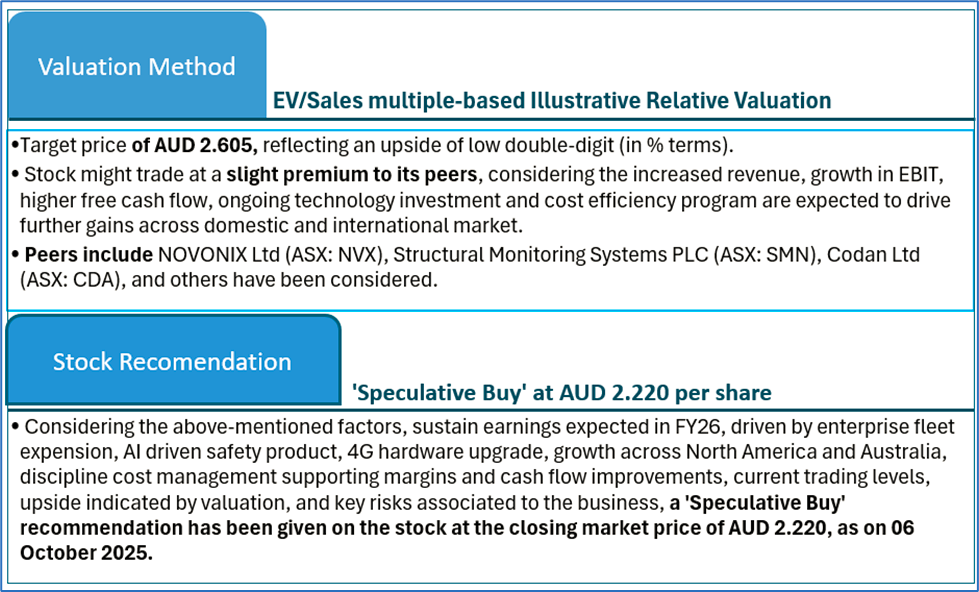
4.2 Fundamental Valuation and Stock Recommendation
Markets are trading in a highly volatile zone currently due to certain macro-economic issues and geopolitical tensions prevailing. Therefore, it is prudent to follow a cautious approach while investing.
Note 1: Past performance is neither an indicator nor a guarantee of future performance.
Note 2: The reference date for all price data, currency, technical indicators, support, and resistance levels is 06 October 2025. The reference data in this report has been partly sourced from REFINITIV.
Note 3: Investment decisions should be made depending on an individual's appetite for upside potential, risks, holding duration, and any previous holdings. An 'Exit' from the stock can be considered if the Target Price mentioned as per the Valuation and or the technical levels provided has been achieved and is subject to the factors discussed above.
Note 4: Kalkine reports are prepared based on the stock prices captured either from REFINITIV or Trading View. Typically, REFINITIV or Trading View may reflect stock prices with a delay which could be a lag of 25-30 minutes. There can be no assurance that future results or events will be consistent with the information provided in the report. The information is subject to change without any prior notice.
Technical Indicators Defined: -
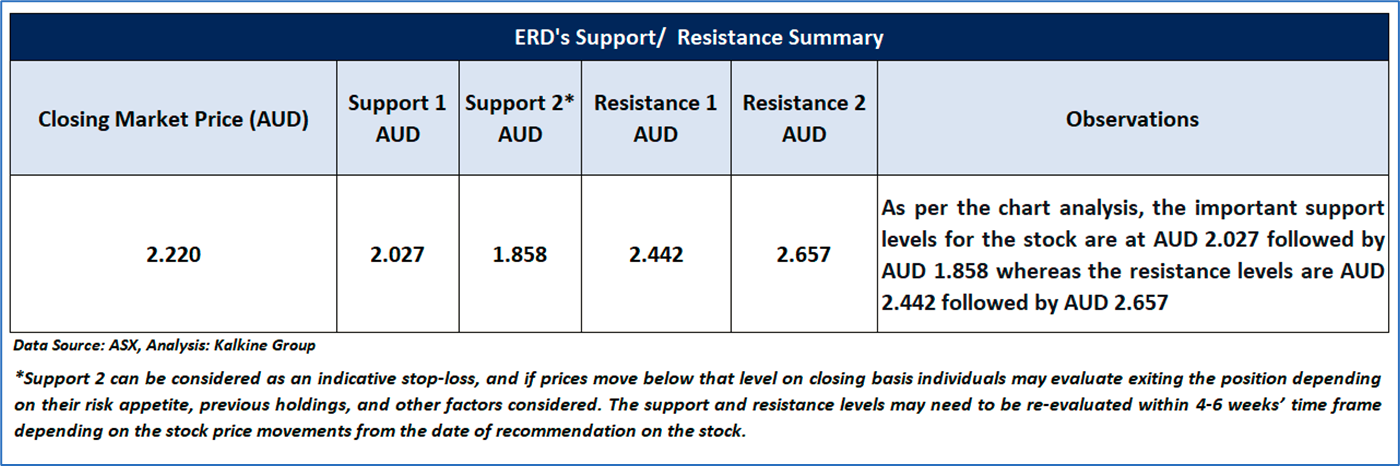
Support: A level at which the stock prices tend to find support if they are falling, and a downtrend may take a pause backed by demand or buying interest. Support 1 refers to the nearby support level for the stock and if the price breaches the level, then Support 2 may act as the crucial support level for the stock.
Resistance: A level at which the stock prices tend to find resistance when they are rising, and an uptrend may take a pause due to profit booking or selling interest. Resistance 1 refers to the nearby resistance level for the stock and if the price surpasses the level, then Resistance 2 may act as the crucial resistance level for the stock.
Stop-loss: It is a level to protect further losses in case of unfavourable movement in the stock prices.
Disclaimer This report has been issued by Kalkine New Zealand Limited (FSP691351) (NZBN:9429047678101) (“Kalkine”). Kalkine is a Financial Advice Provider (“FAP”) and is authorised by a Class 1 Financial Advice Provider Licence issued by Financial Markets Authority (“FMA”) to provide financial advice. Kalkine provides only general financial advice through its research reports following a person becoming a member. The reports contain buy/sell/hold and other recommendations in relation to equity securities, managed funds and other managed investment schemes and other financial advice products. The recommendations and opinions in this report and on Kalkine website do not take into account any of your investment objectives, financial situation or needs. Before you make a decision about whether to acquire a financial product, you should obtain the Product Disclosure Statement from the product issuer. You should consider the appropriateness of advice taking into account your own objectives, financial situation and needs and seek independent financial advice before making any financial decisions. If you act on the advice in the research reports, you may have to pay fees, expenses or other amounts (but not to Kalkine). Further information about the complaints and dispute resolution process, as well as information about Kalkine’s duties are available on Kalkine’s website. Please read our Financial Advice Provider (FAP) disclosure statement and Complaints Handling Guide, which are available on the website.
Past performance is not a reliable indicator of future performance.
 Please wait processing your request...