
Company Overview: Australia and New Zealand Banking Group Limited (NZX: ANZ) is involved in providing a range of banking and financial products and services. It operates in segments such as Australia; New Zealand; Institutional; Asia Retail & Pacific; Wealth Australia, and Technology, Services and Operations (TSO) and Group Centre. Its operations span to New Zealand, Australia, and several of countries in the Asia Pacific region, the United States, France, Germany and the United Kingdom.
The New Zealand division comprises the retail and the commercial business units, and the Australia division comprises of the retail and the corporate and commercial banking (C&CB) business units. The Wealth Australia division has funds management business units, and the Asia Retail & Pacific division consists of the Asia retail and the Pacific business units. The Institutional division services global institutional and business customers. The TSO and Group Centre division provides support to the operating divisions.
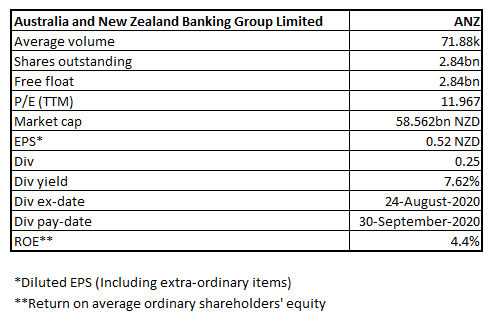
ANZ Details
ANZ Reported Good Set of Numbers: Australia and New Zealand Banking Group Limited (NZX: ANZ) provides banking and financial products and services to individual and business customers and operates in and across 33 markets. The bank has a market capitalization of ~$58.562 billion as on October 12, 2020.
Results Performance (Third Quarter Ended 30th June 2020)
For the third quarter to 30 June 2020, Australia and New Zealand Banking Group Limited has reported an unaudited statutory profit of $1,327 million with an unaudited cash profit from continuing operations of $1,498 million. The bank has also proposed a fully franked interim dividend of 25 cents per share.
The bank’s capital position remains strong, with a Level 2 Common Equity Tier 1 capital (CET1) ratio of 11.1% as on 30 June 2020.
Figure 1: Financial Performance Summary
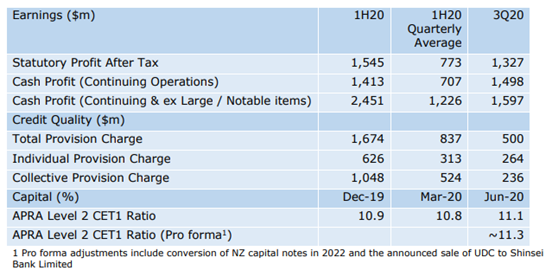
Source: Company Reports
Results Performance (Half-Year Ended 31st March 2020)
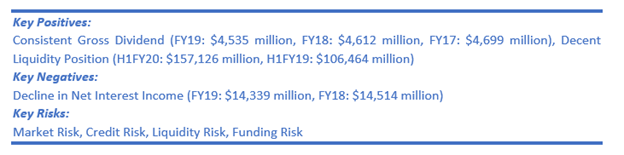
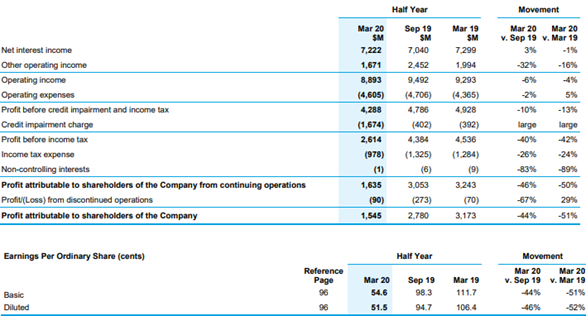
The Group reported statutory profit after tax of $1.55 billion for half year ended 31 March 2020, a decrease of 51% on the prior comparable period. Cash profit from continuing operations stood at $1.41 billion, a decline of 60% on pcp.
Its operating income in the interim period stood at $8.89 billion, a decline of 4% on pcp. Net interest income declined by 1% (y-o-y) to $7.22 billion, and other operating income declined by 16% (y-o-y) to $1.67 billion.
Figure 2: Income Statement (Half-year Ended March 2020)
Source: Company Reports
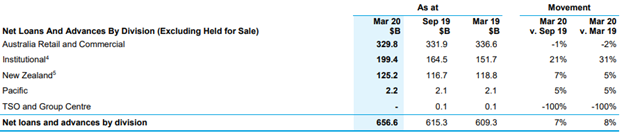
Net loans and advances (excluding held for sale) for Australia Retail and Commercial division stood at $329.8 billion, a decline of 2% (y-o-y), New Zealand division at $125.2 billion, an increase of 5% (y-o-y), and Institutional division at $199.4 billion, an increase of 31% (y-o-y).
Figure 3: Net Loans and Advances
Source: Company Reports
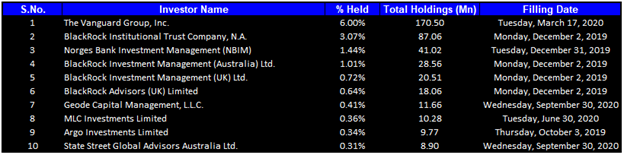
Top 10 Shareholders: The top 10 shareholders have been highlighted in the table, which together forms around 14.31% of the total shareholding. The Vanguard Group, Inc. and BlackRock Institutional Trust Company, N.A. are holding maximum stake in the company at 6.00% and 3.07%, respectively, as provided in the table below:
Figure 4: Top 10 Shareholders
Source: Refinitiv (Thomson Reuters)
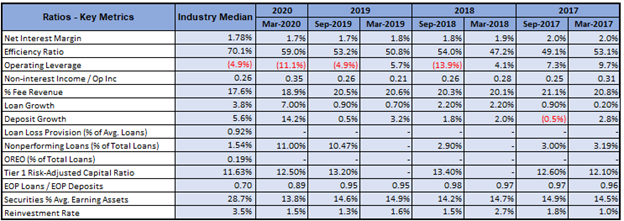
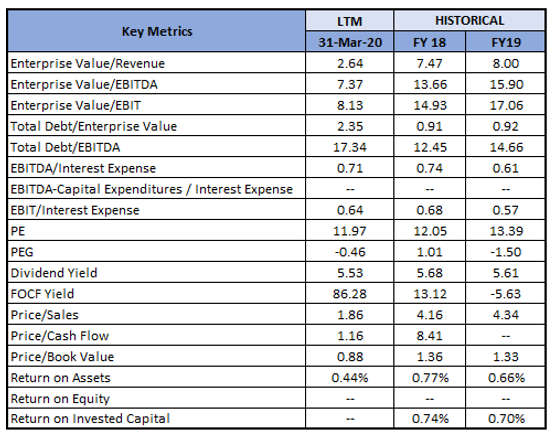
A Quick Look at Key Metrics: The net interest margin for H1FY20 stood at 1.7%, in-line with the H1FY19 result of 1.7%, despite tough market conditions, reflecting the strength of the portfolio. Its efficiency ratio (Expenses/Revenue) for H1FY20 stood at 59.0%, better than the industry median of 70.1%. Its loan growth and deposit growth in H1FY20 stood at 7.00% and 14.2%, higher than the industry median of 3.8% and 5.6%, respectively.
Figure 5: Key Metrics
Source: Refinitiv (Thomson Reuters)
Recent Update:
Reserve Bank of New Zealand (or RBNZ) announced a Funding for Lending Program (FLP) to be released in November MPS. FLP happens to be a mechanism for the central bank of New Zealand to offer newly printed cash. This would be made directly to commercial banks and would be provided at special rates. Notably, FLP would be apart from $100 billion of quantitative easing (or QE) cash that has been allocated by the central bank for purchasing NZ Government bonds.
Any uptake in credit demand amid the current economic downturn will determine the success of the scheme. RBNZ reiterated its dovish stance, despite the resilient housing market, improving business sentiments, and other activity indicators (charted below). Overall, ANZ Bank considers RBNZ’s FLP as an economic simulator, primarily supporting a more challenging period ahead in case of no relief from the COVID environment.
.png)
Source: ANZ Website
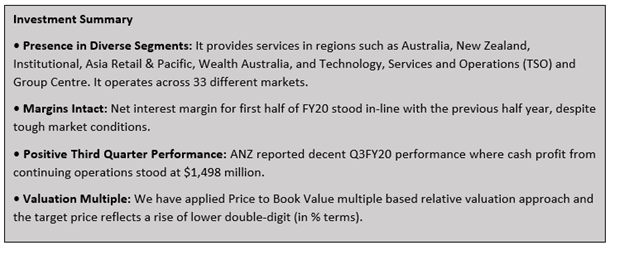
Company Outlook:
The bank’s core businesses continued to perform well with targeted balance sheet growth with respect to preferred segments. The bank continued its focus towards running the business as efficiently as possible. During the quarter, the bank grew home loans in Australia well above the rest of the market. Strong deposit growth was also experienced by the bank, during the quarter. As the bank continues to simplify its business, it announced the sale of UDC in New Zealand and Shinsei Bank and an agreement to sell its off-site ATM fleet in Australia. Going ahead, the management expects some more challenges in the future; however, they are confident that Australia, New Zealand, and the key Asian countries where it operates are well placed to lead a global recovery.
Figure 7: Key Valuation Metrics
Source: Refinitiv (Thomson Reuters)
Valuation Methodology: P/BV Multiple Based Relative Valuation (Illustrative)
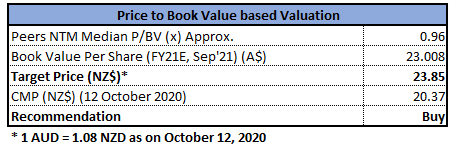
P/BV Multiple Based Relative Valuation (Source: Refinitiv (Thomson Reuters))
Note: All forecasted figures and peers have been taken from Thomson Reuters, NTM-Next Twelve Months
Technical Overview:
Weekly Chart –
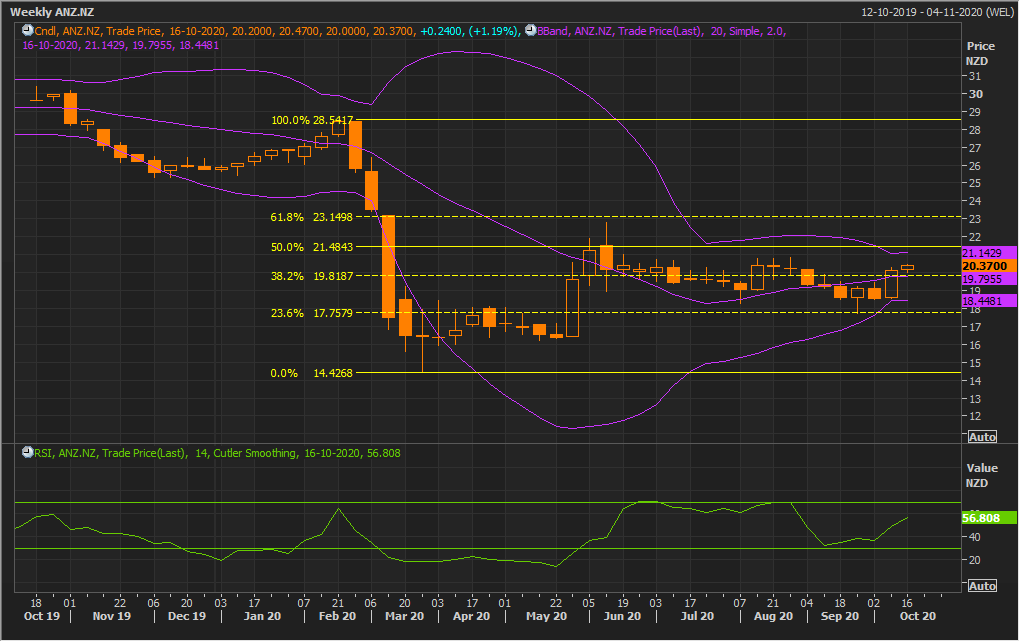
Source: Refinitiv (Thomson Reuters)
Note: Purple colour lines are Bollinger Bands ® with the upper band suggesting overbought status while the lower band oversold status, and yellow lines are Fibonacci retracement lines which measure price rebound and backtrack. https://www.bollingerbands.com/
Continuing with the resilience it showed in the previous week, the stock has given higher closing at $20.37 for the first trading session of the ongoing week. The technical indicator RSI with around 57 reading and curve at the end pointing up, suggests strong bullish momentum for the stock.
Going forward, the stock may have resistance around the 61.8% retracement level of $23.14 whereas support could be around the lower Bollinger band of $18.44.
Stock Recommendation: The banks globally have increased their focus towards quality lending and promising businesses; however, getting support from the government is a big boost for the banks, especially while lending towards micro, small, medium business enterprises to revive the economy. ANZ’s focus on simplifying business and strengthening balance sheet have materially lowered exposure to operational and credit risks.
The bank is conducting reviews focused on high-risk sectors like retailing, oil & gas, and automotive, and continues to run stress tests as a measure of prudent risk management. The capital position of the Group continues to be strong with a Level 2 Common Equity Tier 1 (CET 1) capital ratio of 11.1%. Thus, the bank is well-positioned to manage the crisis.
We have applied P/BV multiple based relative valuation (on an illustrative basis) and the target price reflects a rise of lower double-digit (in % terms).
Considering the aforesaid facts, we give a “Buy” recommendation on the stock at the current market price of NZ$20.370 per share, up by 1.19% on October 12, 2020.
.png)
ANZ Daily Technical Chart (Source: Refinitiv (Thomson Reuters))
Disclaimer
Kalkine New Zealand Limited is authorised to provide class advice only. The information on this site does not take into account any of your investment objectives, financial situation or needs. Before you make a decision about whether to acquire a financial product, you should obtain the Product Disclosure Statement from the product issuer. You should consider the appropriateness of advice taking into account your own objectives, financial situation and needs and seek independent financial advice before making any financial decisions.
Past performance is not a reliable indicator of future performance.
 Please wait processing your request...