
This report is an updated version of the report published on 27 October 2025 at 12:29 pm AEDT
Company Overview: Qantas Airways Limited (ASX: QAN) operates in the aviation industry, providing airline services for international and domestic travel. The company is also engaged in providing freight services. CTI Logistics Limited (ASX: CLX) is an Australian company involved in delivering logistics and transport solutions, specialized flooring logistics, property rental, and security services. The business operates across three main divisions: Logistics Services, Transport Services, and Property. Kalkine’s Market Event Report covers the Investment Summary, Event Summary, Data Insights & Analysis, Key Financial Metrics, Risks, Outlook, Technical Analysis along with the Valuation, Target Price, and Recommendation on the stock.
Investment Summary
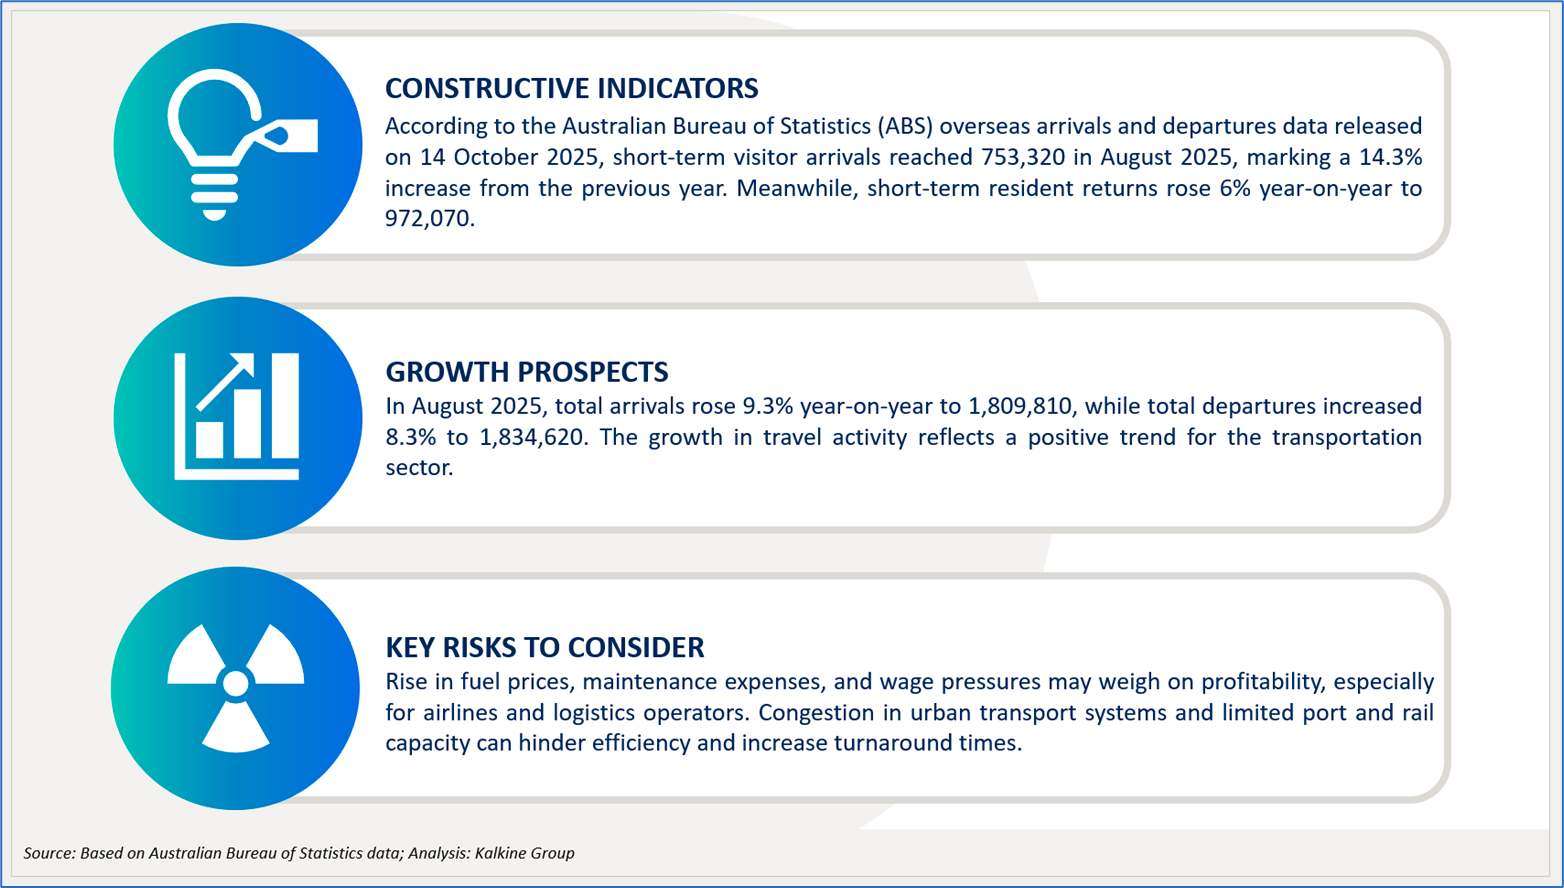
Event Highlights
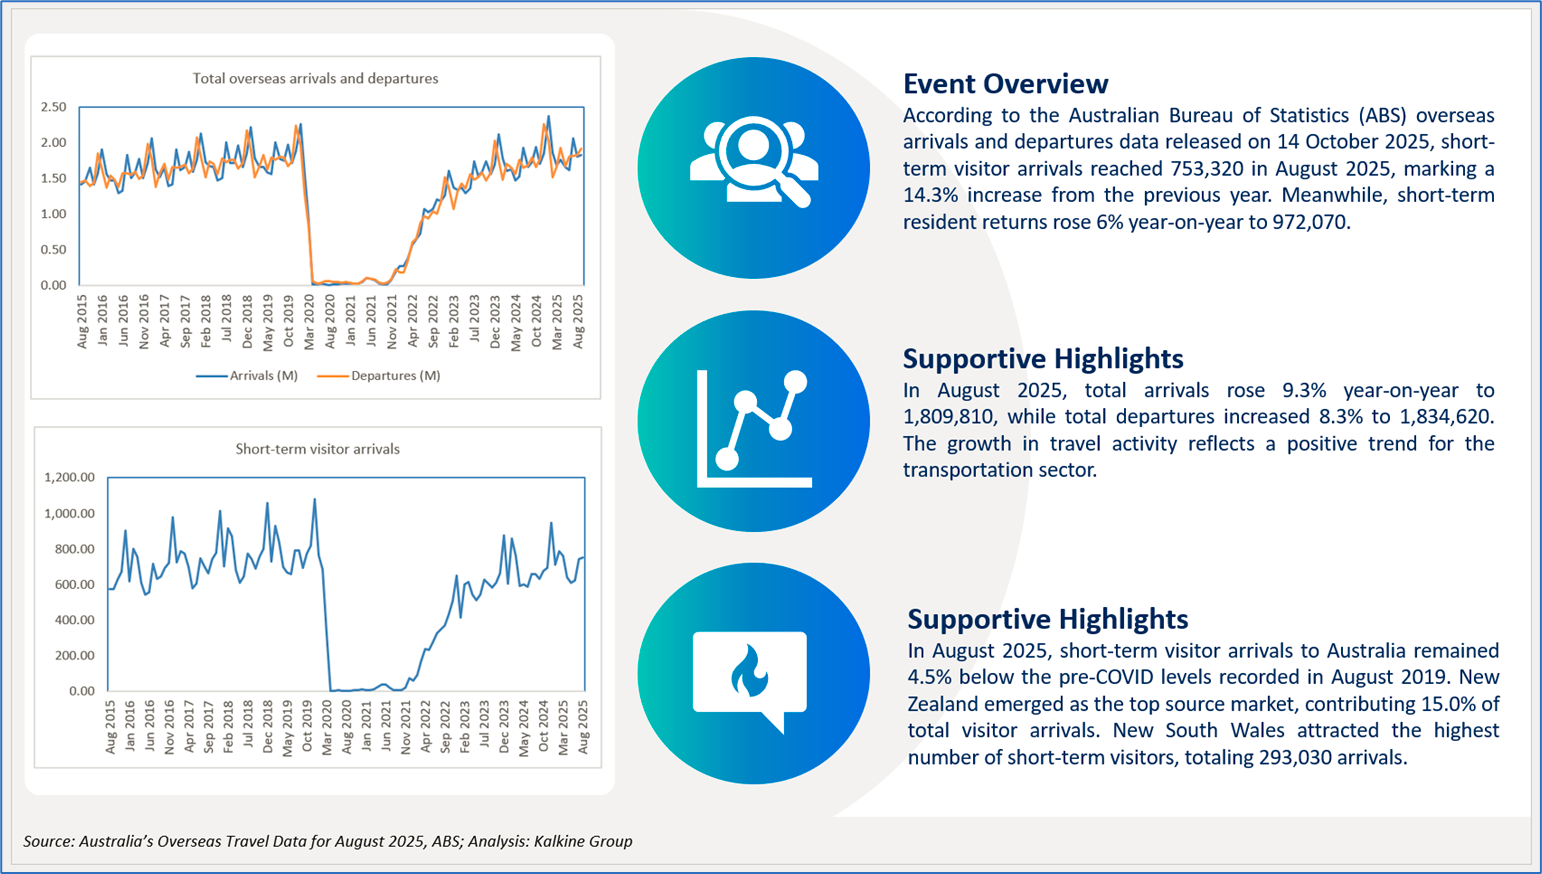
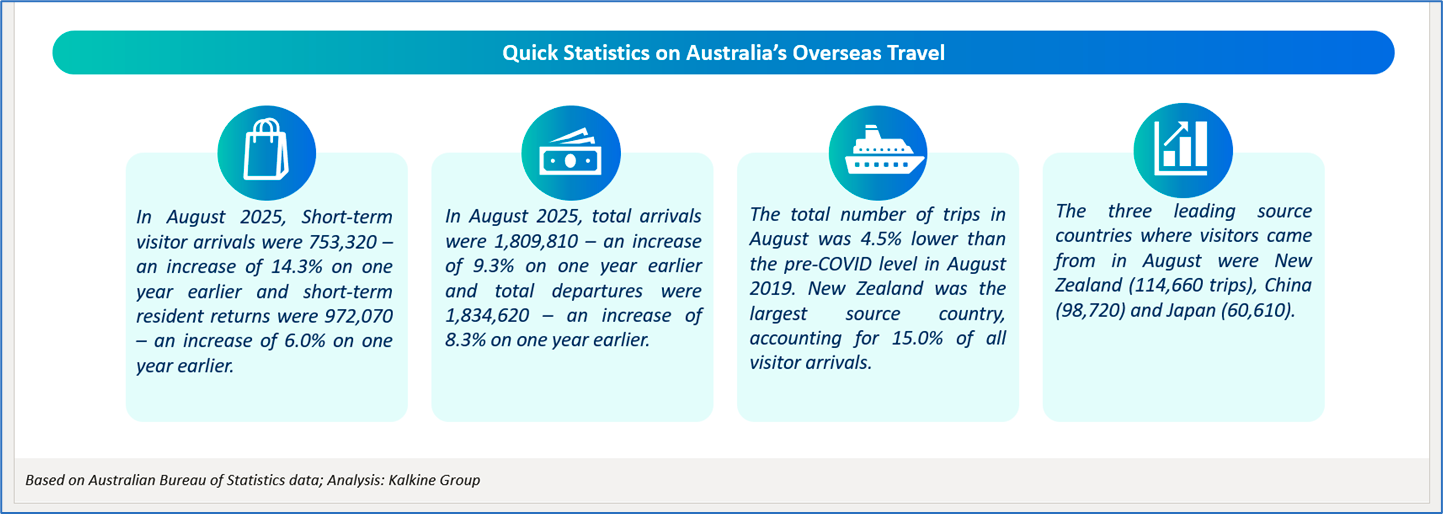
Data Insights and Analysis
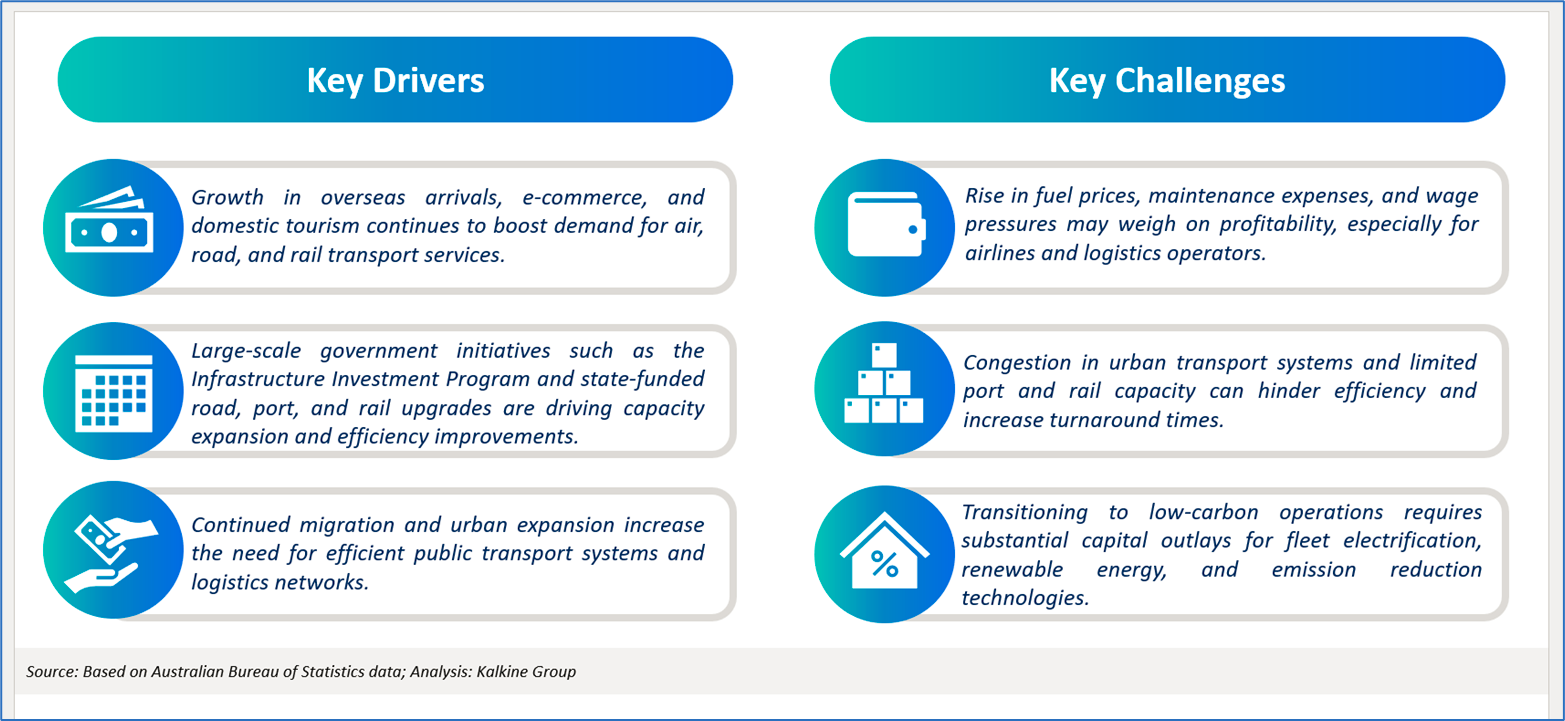
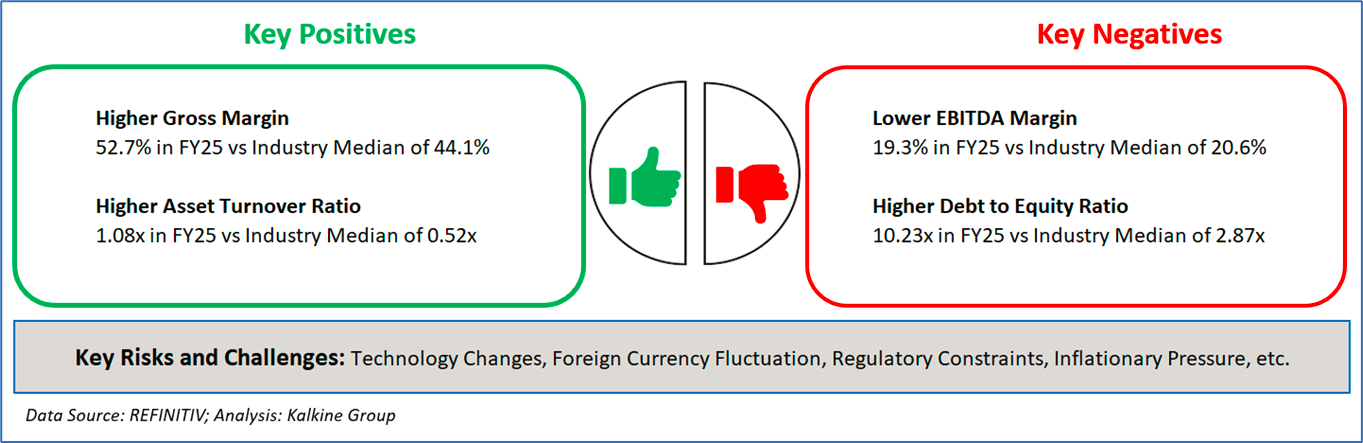
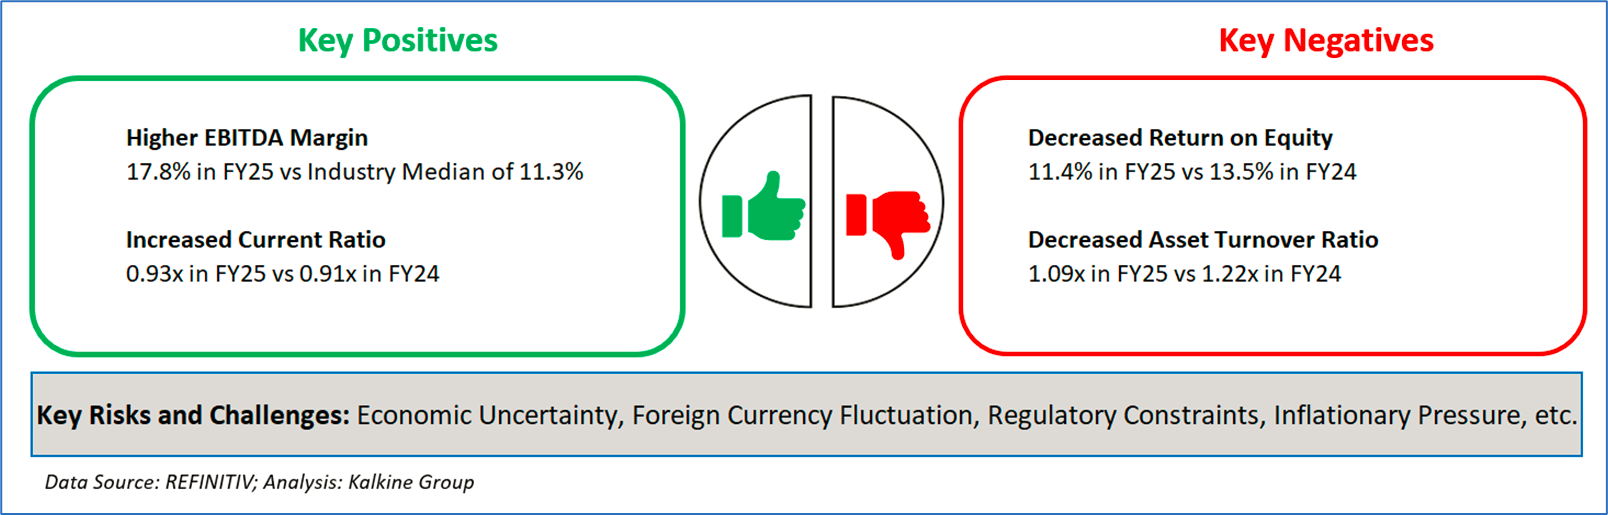
Key Drivers versus Key Challenges
Based on the above data, two ASX stocks have been identified to showcase the momentum.
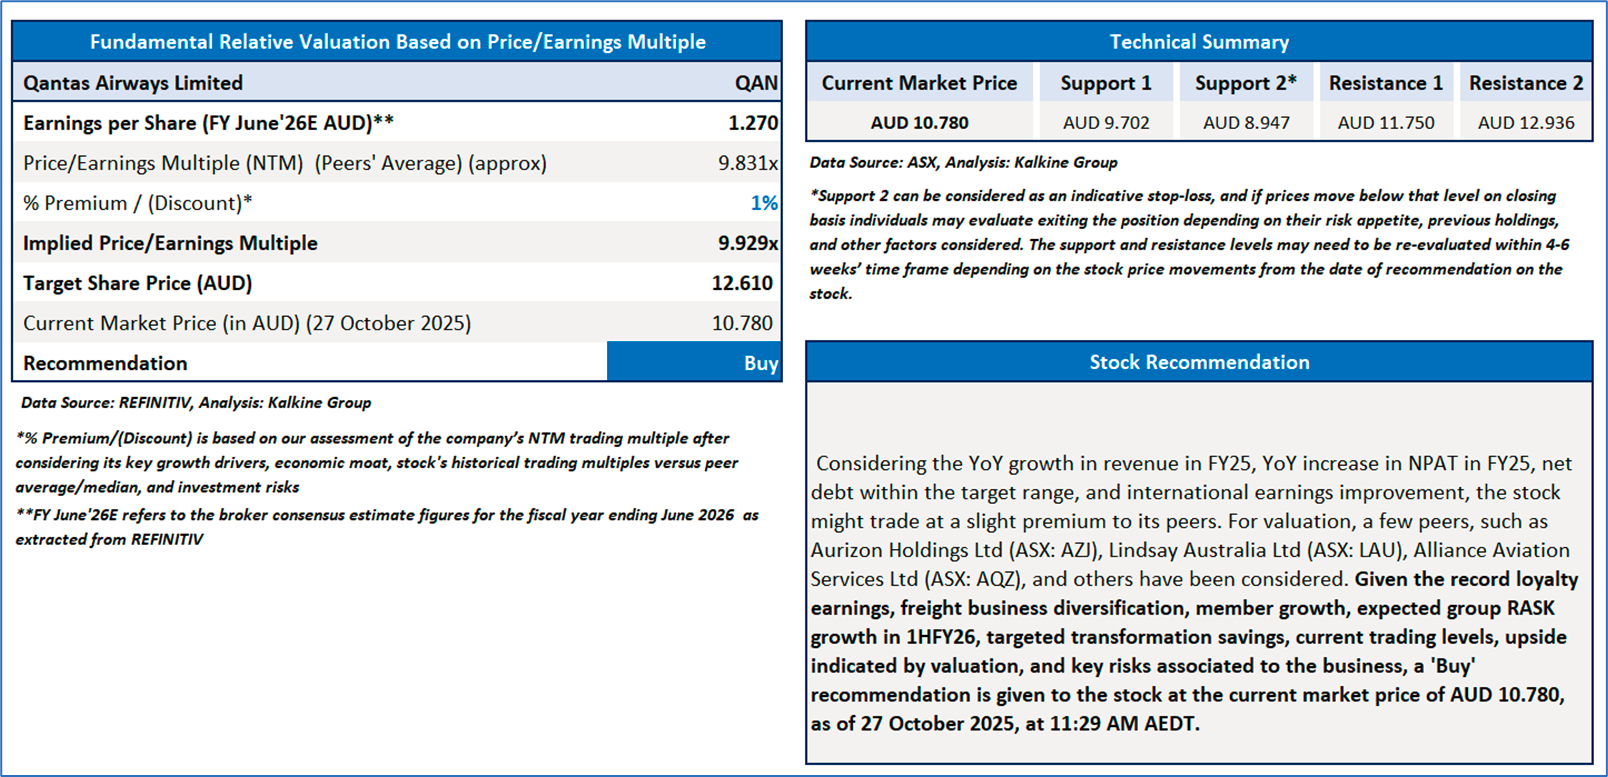
1 Qantas Airways Limited (ASX: QAN) (Recommendation: ‘Buy’ at AUD 10.780, Potential Upside: Low Double-Digit) (M-cap: AUD 15.90bn)
Company Overview: QAN operates in the aviation industry, providing airline services for international and domestic travel. The company is also engaged in providing freight services.
12-month ended 30 June 2025 Financial Year (FY25) Financial Performance: Revenue and other income increased by 8.8% YoY to AUD 23,823mn in FY25 vs AUD 21,939mn in FY24. This growth was primarily driven by robust passenger demand across both domestic and international markets, strategic capacity increases, and improved load factors. Underlying EBITDA reached AUD 4,638mn in FY25 vs AUD 4,052mn in FY24. Statutory profit after tax rose by 28.3% YoY to AUD 1,605mn in FY25 vs AUD 1,251mn in FY24.
Recent Update: On 3 October 2025, QAN notified that 53,205 performance rights lapsed on 30 September 2025. This occurred because the conditions required for the rights to convert into securities were not met.
Outlook: The group's revenue per available seat kilometer (RASK) is anticipated to increase in the first half of the 2026 fiscal year compared to the same period in 1HFY25. Depreciation and Amortization is forecast to be approximately AUD 2.3 billion. Net Finance Costs are projected to be about AUD 0.3 billion.
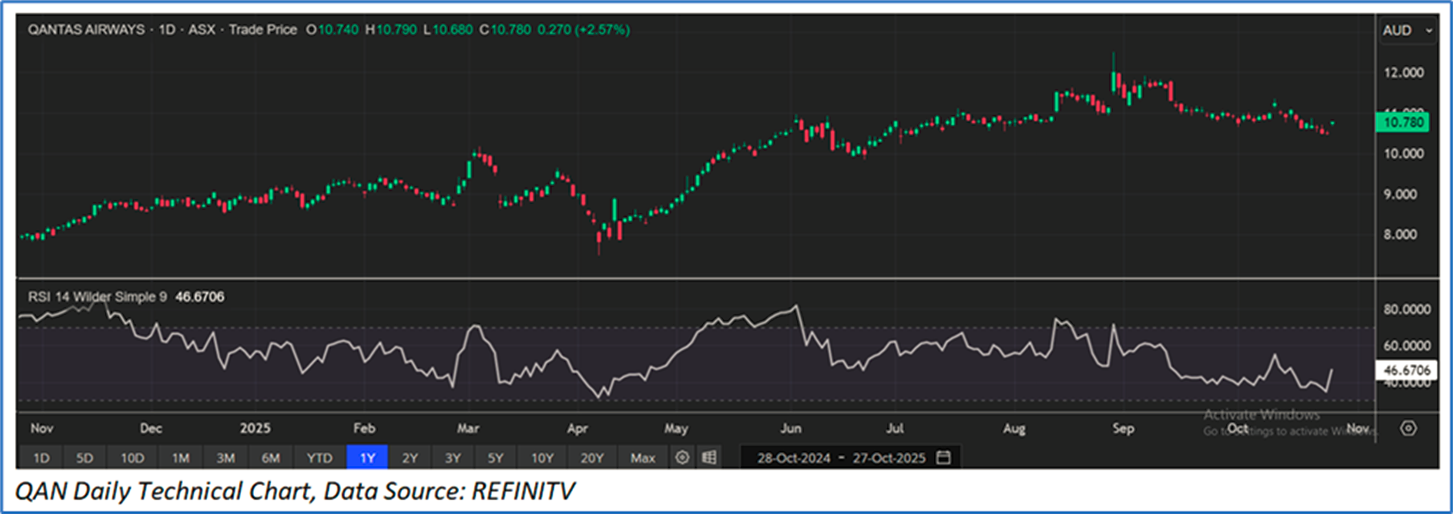
The stock has witnessed a correction of ~1.09% in the last one month, and over the past one year, it increased by ~40.06%. The stock has a 52-week low and 52-week high of AUD 7.550 and AUD 12.620, respectively, and is currently trading above the 52-week high-low average. QAN was last covered in a report dated ‘18 September 2024’.
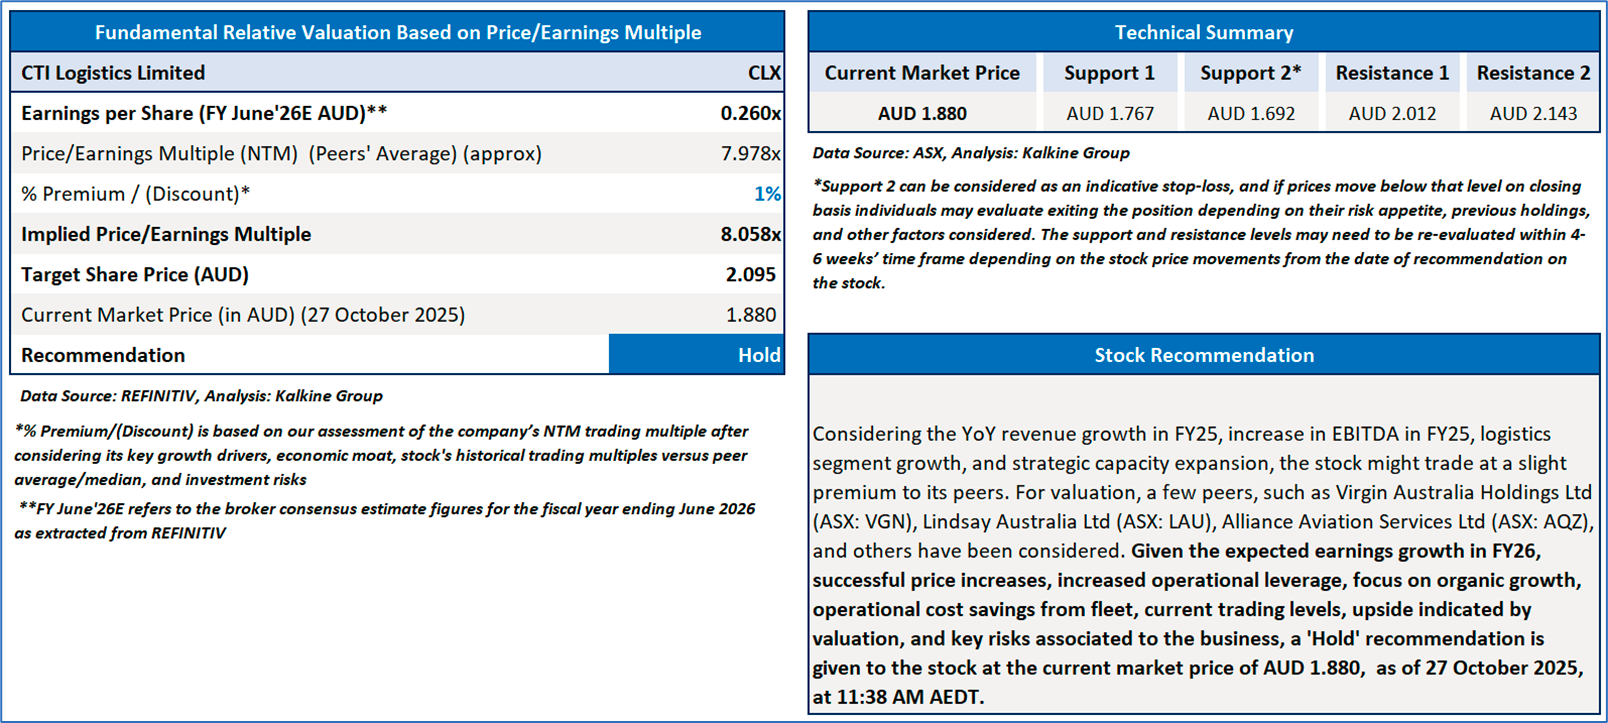
2) CTI Logistics Limited (ASX: CLX) (Recommendation: ‘Hold’ at AUD 1.880, Potential Upside: low double-Digit) (M-cap: AUD 150.13mn)
Company Overview: CLX is an Australian company involved in delivering logistics and transport solutions, specialized flooring logistics, property rental, and security services. The business operates across three main divisions: Logistics Services, Transport Services, and Property.
12-month ended 30 June 2025 Financial Year (FY25) Financial Performance: Revenue rose by 1.3% YoY to AUD 325.43mn in FY25 vs AUD 321.16mn in FY24. This increase was primarily due to growth in its logistics segment. EBITDA increase by 5.3% YoY to AUD 58.9mn in FY25 vs AUD 55.9mn in FY24. Net profit attributable to members went down by 10.28% YoY to AUD 14.21mn in FY25 vs AUD 15.83mn in FY24.
Recent Update: On 21 October 2025, CLX informed that its AGM meeting will be held on Thursday, 27 November 2025, at 5:00 PM (WST). The event location is The Backlot, 21 Simpson Street, West Perth, Western Australia.
Outlook: The company expects earnings growth in FY26. CLX is well positioned to capture future growth, leveraging the expanded capacity from capital investments made between the FY23 to FY25 period. However, forecasting remains challenging due to ongoing fuel price uncertainty, although the company expects labour cost increases to continue moderating.
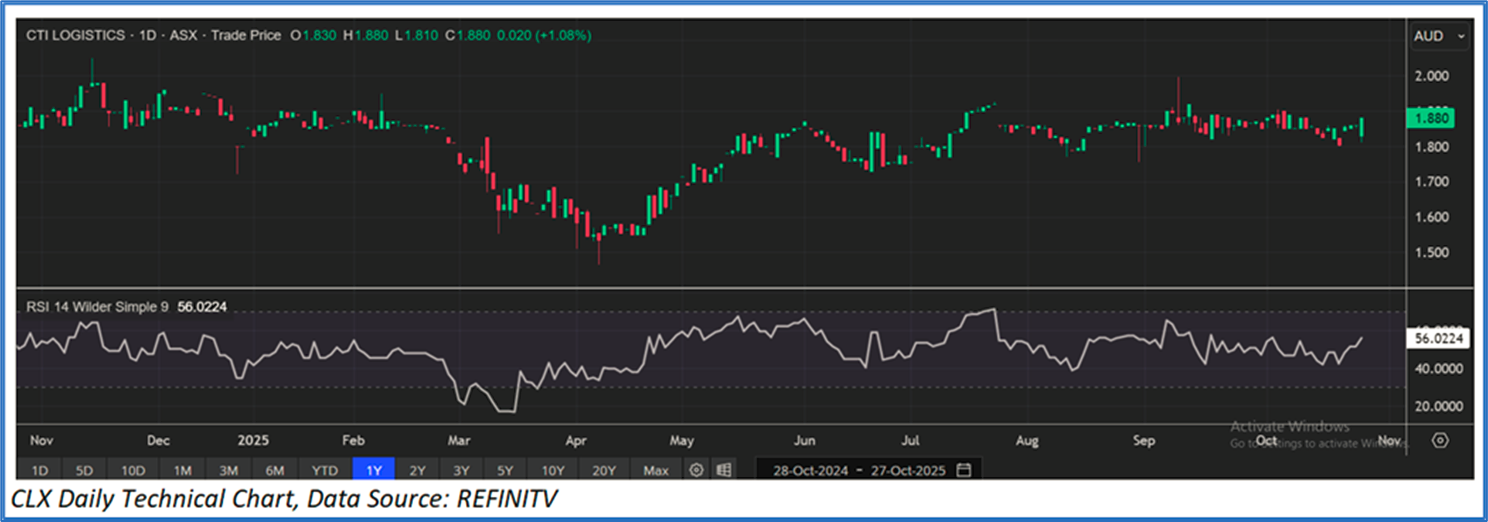
The stock is up by ~0.53% in the last one month, and over the past one year, it increased by ~1.08%. The stock has a 52-week low and 52-week high of AUD 1.465 and AUD 2.050, respectively, and is currently trading above the 52-week high-low average. CLX was last covered in a report dated ‘01 September 2025’.
Markets are trading in a highly volatile zone currently due to certain macro-economic issues and geopolitical tensions prevailing. Therefore, it is prudent to follow a cautious approach while investing.
Note 1: Past performance is neither an Indicator nor a guarantee of future performance.
Note 2: The reference date for all price data, currency, technical indicators, support, and resistance levels is 27 October 2025. The reference data in this report has been partly sourced from REFINITIV.
Note 3: Investment decisions should be made depending on an individual’s appetite for upside potential, risks, holding duration, and any previous holdings. An ‘Exit’ from the stock can be considered if the Target Price mentioned as per the Valuation and or the technical levels provided has been achieved and is subject to the factors discussed above.
Note 4: Kalkine reports are prepared based on the stock prices captured either from REFINITIV or Trading View. Typically, REFINITIV or Trading View may reflect stock prices with a delay which could be a lag of 25-30 minutes. There can be no assurance that future results or events will be consistent with the information provided in the report. The information is subject to change without any prior notice.
Technical Indicators Defined: -
Support: A level at which the stock prices tend to find support if they are falling, and a downtrend may take a pause backed by demand or buying interest. Support 1 refers to the nearby support level for the stock and if the price breaches the level, then Support 2 may act as the crucial support level for the stock.
Resistance: A level at which the stock prices tend to find resistance when they are rising, and an uptrend may take a pause due to profit booking or selling interest. Resistance 1 refers to the nearby resistance level for the stock and if the price surpasses the level, then Resistance 2 may act as the crucial resistance level for the stock.
Stop-loss: It is a level to protect further losses in case of unfavourable movement in the stock prices.
This report (“Report”) has been issued by Kalkine New Zealand Limited (FSP691351) (NZBN:9429047678101) (“Kalkine”). Kalkine is a Financial Advice Provider (“FAP”) and is authorised by a Class 1 Financial Advice Provider Licence issued by Financial Markets Authority (“FMA”) to provide financial advice. Kalkine provides only general financial advice through its research reports following a person becoming a member. The reports contain buy/sell/hold and other recommendations in relation to equity securities, managed funds and other managed investment schemes and other financial advice products. The recommendations and opinions in this Report and on Kalkine website do not take into account any of your investment objectives, financial situation or needs. Before you make a decision about whether to acquire a financial product, you should obtain the Product Disclosure Statement from the product issuer. You should consider the appropriateness of advice taking into account your own objectives, financial situation and needs and seek independent financial advice before making any financial decisions. If you act on the advice in the research reports, you may have to pay fees, expenses or other amounts (but not to Kalkine).
The information in this Report and on the Kalkine website has been prepared from a wide variety of sources, which Kalkine, to the best of its knowledge and belief, considers accurate. Kalkine has made every effort to ensure the reliability of the information contained in its reports (including this Report), newsletters and websites. All information represents our views at the date of publication and may change without notice.
Kalkine does not issue, sell or deal in any financial products. The information in this Report does not constitute an offer to sell securities or other financial products or a solicitation of an offer to buy securities or other financial products. Our reports contain general recommendations to invest in securities and other financial products. Kalkine is not responsible for, and does not guarantee, the performance of, or returns on, any investments mentioned in this Report.
This Report may contain information on past performance of particular investments. Past performance is not a reliable indicator of future performance. Returns stated do not take into account transaction costs and taxes.
Further information about the complaints and dispute resolution process, as well as information about Kalkine’s duties are available on Kalkine’s website. Please read our Financial Advice Provider (FAP) disclosure statement and Complaints Handling Guide, which are available on the website.
Copyright 2025 Krish Capital Pty. Ltd. (ABN 61629651510). All Rights Reserved. No part of this Report, or its content, may be reproduced in any form without our prior consent.
Past performance is not a reliable indicator of future performance.
 Please wait processing your request...