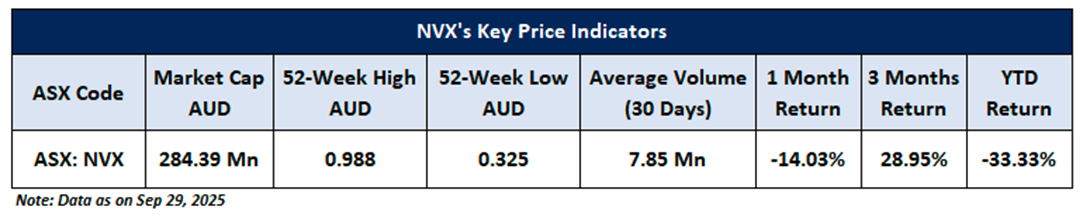
Company Overview: NOVONIX Limited (ASX: NVX) is a battery materials and technology company focused on advancing the global lithium-ion battery industry. It provides innovative materials, specialized equipment, and technical services designed to enhance battery performance, efficiency, and sustainability. Through its solutions, NOVONIX supports the growing demand for high-performance energy storage in applications such as electric vehicles, renewable energy integration, and consumer electronics. Below are the key price indicators for the stock: This Report covers the Price Action, Technical Indicators Analysis along with the Stop Loss Levels, Target Prices, and Recommendation on this one stock.
ASX All Ordinaries Index (.AORD) Market Round-Up
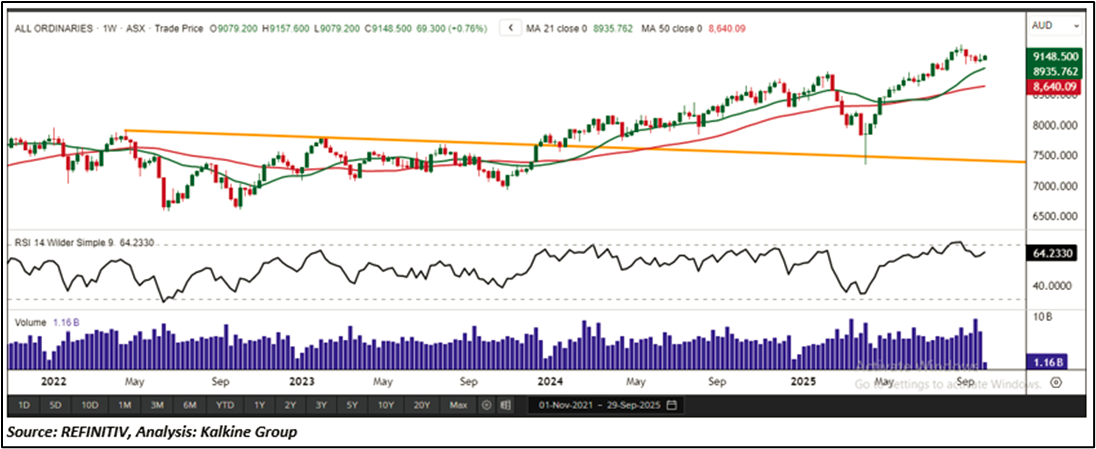
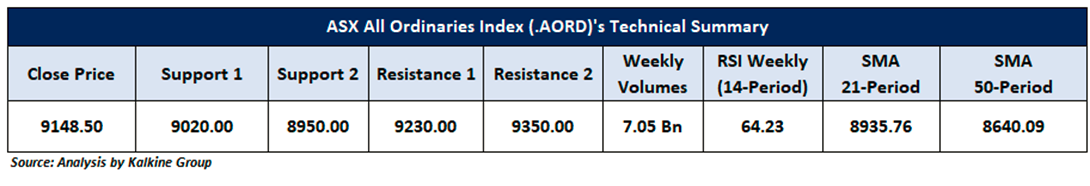
The ASX All-Ordinaries Index (.AORD) closed the week at 9,079.20, registering a modest gain of 0.20%. Although weakness in U.S. equities weighed on global sentiment and triggered some selling interest locally, it was not enough to offset the broader downward pressure across the Australian market.
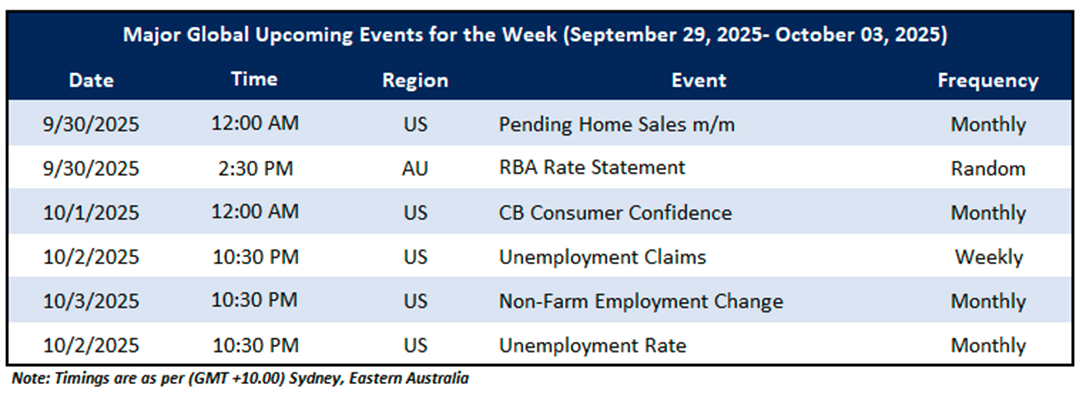
From a technical standpoint, the index is holding firmly above a key falling trendline support, signalling strengthening upward momentum. It also remains above the 21-period Simple Moving Average (SMA), reinforcing the bullish structure and supporting the prevailing uptrend. The upcoming macroeconomic events that may impact the market sentiments include an update on the AU RBA Rate Statement, US Non-Farm Employment Change and US Unemployment Claims, etc., released weekly.
Global Markets Wrap-Up
Wall Street ended the week on a weaker note, with major indices losing momentum after recent gains. For the week ending September 26, 2025, the S&P 500 slipped 0.31% to close at 6,643.70, while the NASDAQ Composite declined 0.65% to finish at 22,484.07. On the economic front, data from the U.S. Department of Labor showed that initial jobless claims fell by 14,000 to a seasonally adjusted 218,000 for the week ending September 20, 2025, down from the prior week’s revised figure of 232,000.
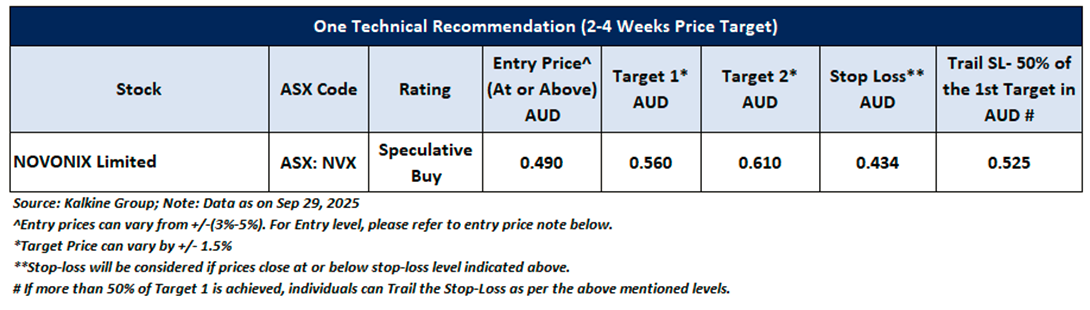
Having understood the US market performance over the past week, taking cues from major global news, and based on technical analysis of the ASX All-Ordinaries Index (.AORD) for the upcoming week, now let us have a look at one ASX-listed stock from the technical standpoint. Noted below recommendation is based on entry price, target prices, and stop-loss for NOVONIX Limited (ASX: NVX) for the next 2-4 weeks duration: -
NOVONIX Limited (ASX: NVX)
Noted below are the key price indicators for the stock:
Price Action Analysis (On the Daily Chart)
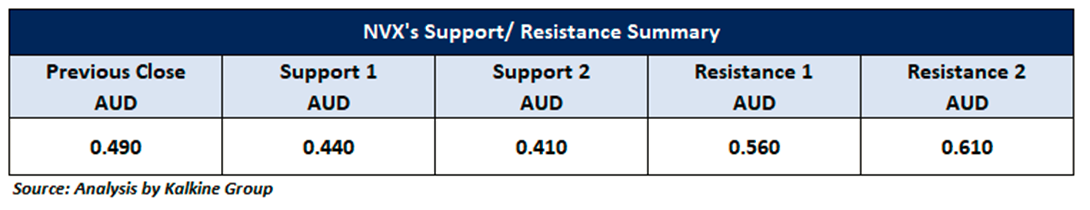
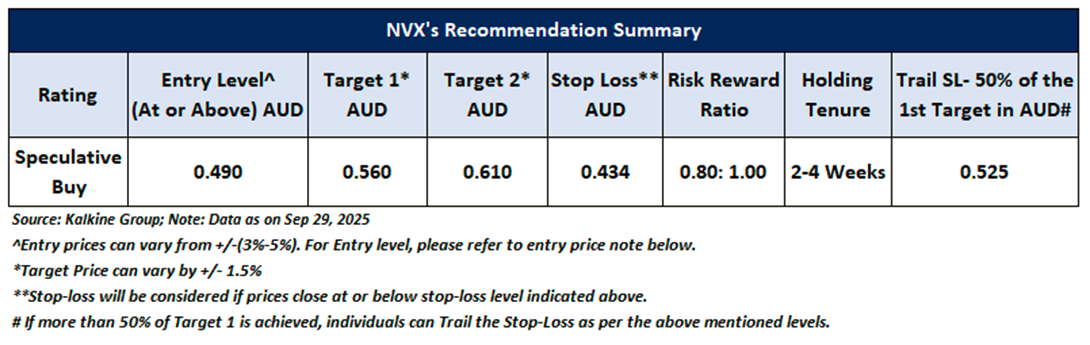
On the daily chart, NVX is trading above a key rising trendline support, strengthening the case for sustained bullish momentum. This support zone has played a pivotal role in preserving positive sentiment and the stock’s upward trajectory. In the near term (2–4 weeks), the stock is approaching a critical resistance level at AUD 0.560. A decisive breakout above this level, especially if accompanied by rising volumes, could trigger renewed buying interest and pave the way toward the next upside target near AUD 0.610.
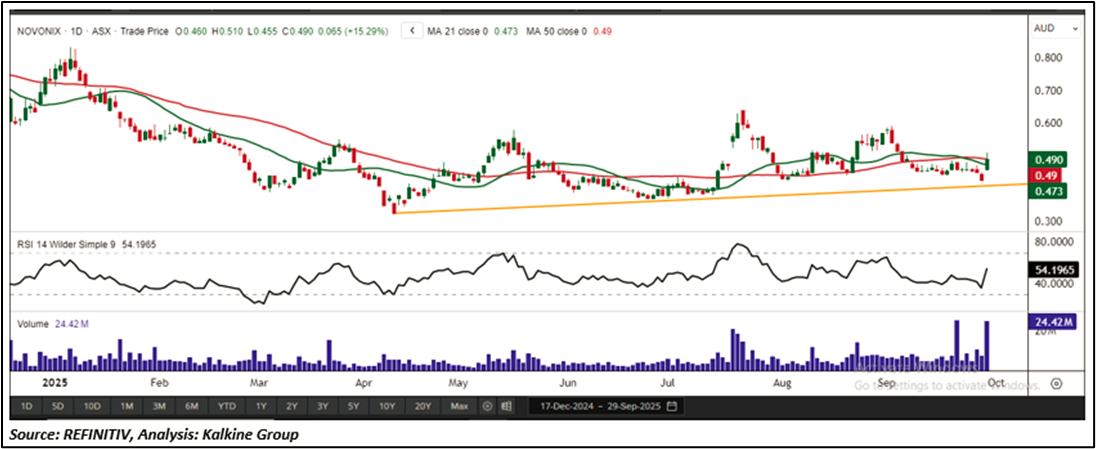
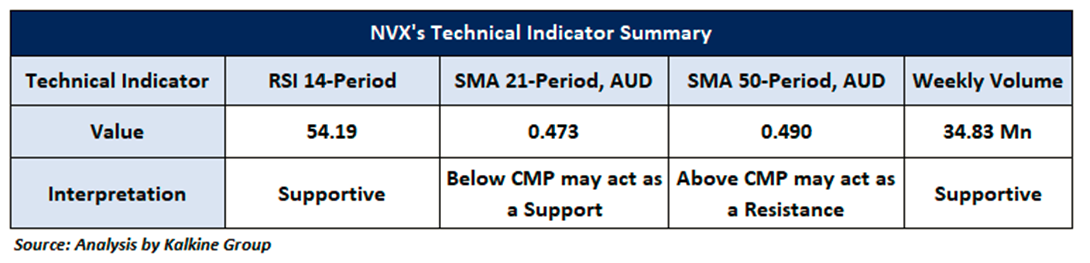
Technical Indicators Analysis (On the Daily Chart)
On the daily chart, the 14-period Relative Strength Index (RSI) is hovering at 54.19, signalling improving momentum and building bullish pressure. Volume trends further support this view, pointing to sustained underlying buying interest. In addition, the stock remains above its 21-period Simple Moving Average (SMA), which continues to provide dynamic support.
General Recommendation:
As per the above-mentioned price action and technical indicators analysis, NOVONIX Limited is looking technically well-placed on the chart, and a ‘Speculative Buy’ recommendation has been given on the stock. Investment decision should be made depending on an individual’s appetite for an upside potential, risks, and any previous holdings. This recommendation is purely based on technical indicator analysis, and fundamental analysis has not been considered in this report. NOVONIX Limited (ASX: NVX) was last covered in a report dated '22 August 2025'. Summary of recommendation is as follows:
Markets are trading in a highly volatile zone currently due to certain macro-economic and prevailing geopolitical tensions. Therefore, it is prudent to follow a cautious approach while investing.
Upcoming Major Global Economic Events
Market events occur on a day-to-day basis depending on the frequency of the data and generally include update on employment, inflation, GDP, consumer sentiments, etc. Noted below are the upcoming week's major global economic events that could impact the ASX All-Ordinaries Index and listed stocks’ prices:
Related Risks: This report may be looked at from high-risk perspective and recommendations are provided are for a short duration. Recommendations provided in this report are solely based on technical parameters, and the fundamental performance of the stocks has not been considered in the decision-making process. Other factors which could impact the stock prices include market risks, regulatory risks, interest rates risks, currency risks, social and political instability risks etc.
Kalkine reports are prepared based on the stock prices captured from either REFINITIV or Trading View. Typically, REFINITIV or Trading View may reflect stock prices with a delay which could be a lag of 25-30 minutes. There can be no assurance that future results or events will be consistent with the information provided in the report. The information is subject to change without any prior notice.’
Note 1: Past performance is not a reliable indicator of future performance.
Note 2:Individuals can consider exiting from the stock if the Target Price mentioned as per the technical analysis has been achieved and subject to the factors discussed above.
Note3: How to Read the Charts?
The Green colour line reflects the 21-period moving average while the red line indicates the 50-period moving average. SMA helps to identify existing price trend. If the prices are trading above the 21-period and 50-period moving average, then it shows prices are currently trading in a bullish trend.
The Black colour line in the chart’s lower segment reflects the Relative Strength Index (14-Period) which indicates price momentum and signals momentum in trend. A reading of 70 or above suggests overbought status while a reading of 30 or below suggests an oversold status.
The Blue colour bars in the chart’s lower segment show the volume of the stock. The volume is the number of shares that changed hands during a given day. Stocks with high volumes are more liquid than stocks with lesser volume. Liquidity in stocks helps in easier and faster execution of the order.
The Orange colour lines are the trend lines drawn by connecting two or more price points and used for trend identification purposes. The trend line also acts as a line of support and resistance.
Technical Indicators Defined: -
Support: A level at which the stock prices tend to find support if they are falling, and a downtrend may take a pause backed by demand or buying interest. Support 1 refers to the nearby support level for the stock and if the price breaches the level, then Support 2 may act as the crucial support level for the stock.
Resistance: A level at which the stock prices tend to find resistance when they are rising, and an uptrend may take a pause due to profit booking or selling interest. Resistance 1 refers to the nearby resistance level for the stock and if the price surpasses the level, then Resistance 2 may act as the crucial resistance level for the stock.
Stop-loss: It is a level to protect further losses in case of unfavourable movement in the stock prices.
Risk Reward Ratio: Risk reward ratio is the difference between an entry point to a stop loss and profit level. This report is based on ~80% Stop Loss of the Target 1 from the entry point.
A trailing stop-loss is a modification of stop-loss in case of favourable movement in the price to protect the gains. Individuals can Trail the Stop-Loss as per the aforementioned levels if the stock price achieves more than 50% of the Target 1.Individuals should consider exiting from the position as per the Trailing Stop-Loss level if the price starts moving downwards after achieving more than 50% of the Target 1.
The reference date for all price data, currency, technical indicators, support, and resistance levels is September 29, 2025. The reference data in this report has been partly sourced from REFINITIV.
Abbreviations
CMP: Current Market Price
SMA: Simple Moving Average
AUD: Australian Dollar
RSI: Relative Strength Index
Note: Trading decisions require a thorough analysis by individuals. Technical reports in general chart out metrics that may be assessed by individuals before any stock evaluation. The above are illustrative analytical factors used for evaluating the stocks; other parameters can be looked at along with additional risks per se. Past performance is neither an indicator nor a guarantee of future performance.
Disclaimer This report has been issued by Kalkine New Zealand Limited (FSP691351) (NZBN:9429047678101) (“Kalkine”). Kalkine is a Financial Advice Provider (“FAP”) and is authorised by a Class 1 Financial Advice Provider Licence issued by Financial Markets Authority (“FMA”) to provide financial advice. Kalkine provides only general financial advice through its research reports following a person becoming a member. The reports contain buy/sell/hold and other recommendations in relation to equity securities, managed funds and other managed investment schemes and other financial advice products. The recommendations and opinions in this report and on Kalkine website do not take into account any of your investment objectives, financial situation or needs. Before you make a decision about whether to acquire a financial product, you should obtain the Product Disclosure Statement from the product issuer. You should consider the appropriateness of advice taking into account your own objectives, financial situation and needs and seek independent financial advice before making any financial decisions. If you act on the advice in the research reports, you may have to pay fees, expenses or other amounts (but not to Kalkine). Further information about the complaints and dispute resolution process, as well as information about Kalkine’s duties are available on Kalkine’s website. Please read our Financial Advice Provider (FAP) disclosure statement and Complaints Handling Guide, which are available on the website.
Past performance is not a reliable indicator of future performance.
 Please wait processing your request...