
Company Overview: Cettire Limited (ASX: CTT) is an online retailer engaged in offering a large selection of in-demand personal luxury goods. The company offers access to more than 2,500 luxury brands and 500,000 products ranging from clothing, shoes, bags to accessories. Chalice Mining Limited (ASX: CHN) operates as a mineral exploration and evaluation company which has interest in the Gonneville Nickel-Copper-PGE Project located in Western Australia. This Report covers the Price Action, Technical Indicators Analysis along with the Stop Loss Levels, Target Prices, and Recommendations on these two stocks.
ASX All Ordinaries Index (.AORD) Market Round-Up
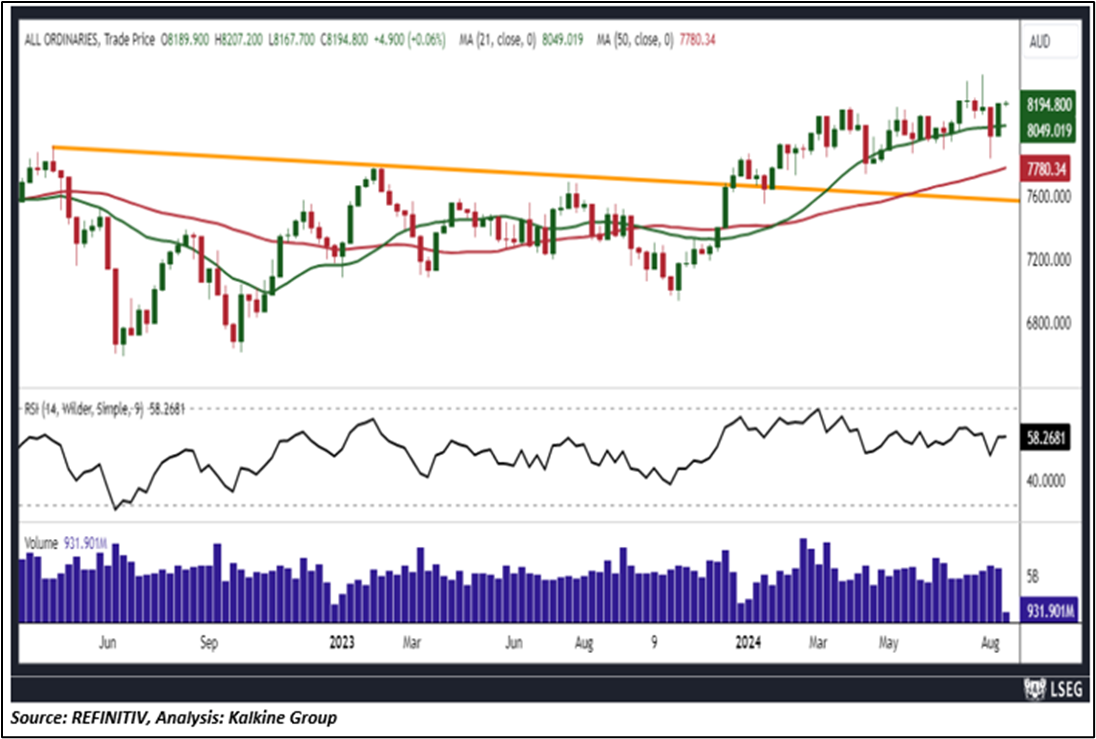
Last week, the ASX All-Ordinaries Index (.AORD) settled on a positive note, following the bullish move from the US equity markets. Notably, AORD settled at 8189.90 with a gain of 2.49% for the week ending August 16, 2024. The recent move in the domestic indices is majorly led by the positive indications from the global equity markets.
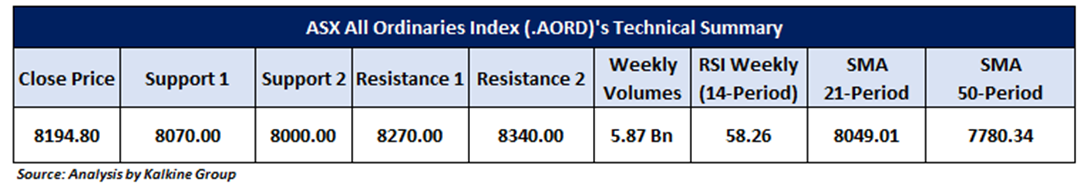
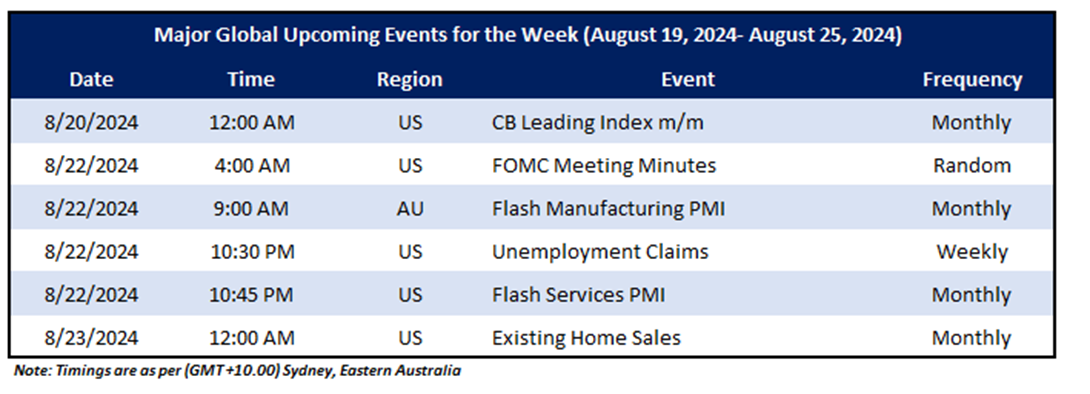
On the technical front, the prices are trading above the downward sloping trendline support and are taking support from the trendline. Moreover, the prices are trading above the 50-period SMA, which may act as a support level for the index. The upcoming macroeconomic events that may impact the market sentiments include an update on the AU Flash Manufacturing PMI, US FOMC Meeting Minutes, and US Unemployment Insurance Claims, etc., released weekly.
Global Markets Wrap-Up
Wall Street indices inched higher in the last week and settled on a positive note. Notably, the S&P 500 settled at 5554.25 with a gain of ~3.93%, while NASDAQ Composite Index settled at 17631.72 with a gain of ~5.29% for the week ending August 16, 2024. The seasonally adjusted initial US unemployment insurance claims data published by the US Department of Labor decreased by 7k to 227k for the week ending 10 August 2024 against the revised Unemployment Insurance Claims at 234k in the prior week.
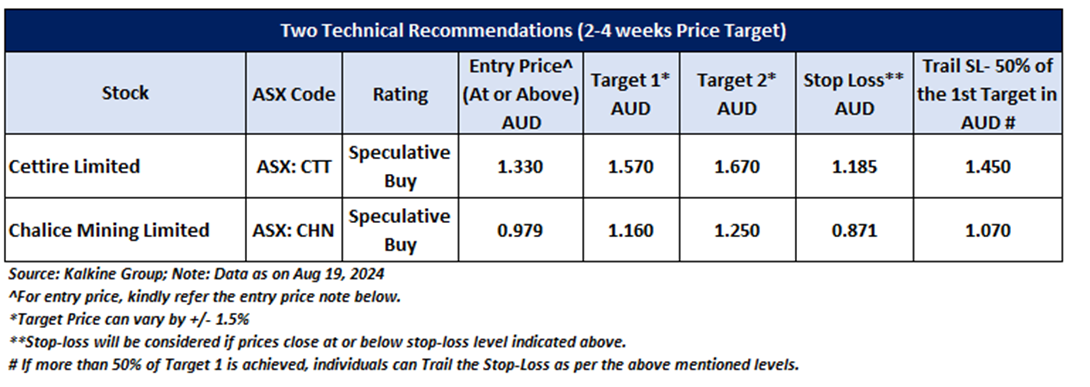
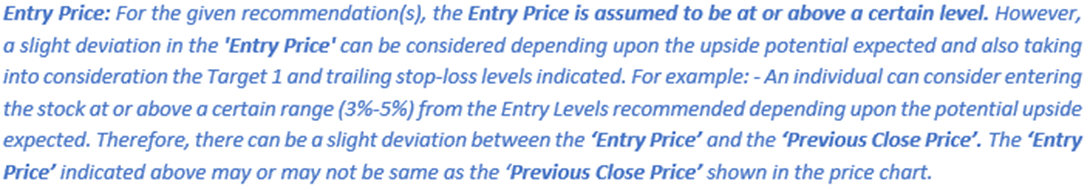
Having understood the US market performance over the past week, taking cues from major global news, and based on technical analysis of the ASX All-Ordinaries Index (.AORD) for the upcoming week, now let us have a look at two ASX-listed stocks from the technical standpoint. Noted below recommendations are based on entry price, target prices, and stop-loss for Cettire Limited (ASX: CTT) and Chalice Mining Limited (ASX: CHN) for the next 2-4 weeks duration:-
Cettire Limited (ASX: CTT)
Noted below are the key price indicators for the stock:
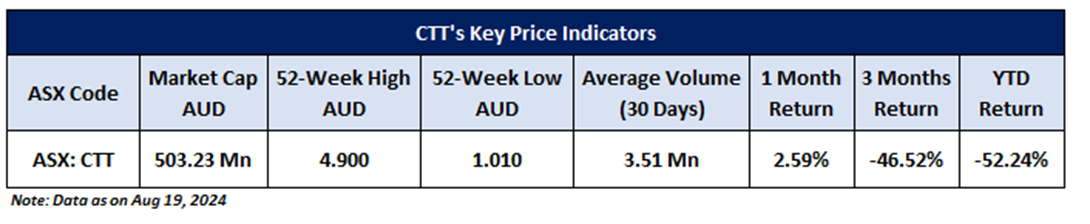
Price Action Analysis (on the Daily Chart)
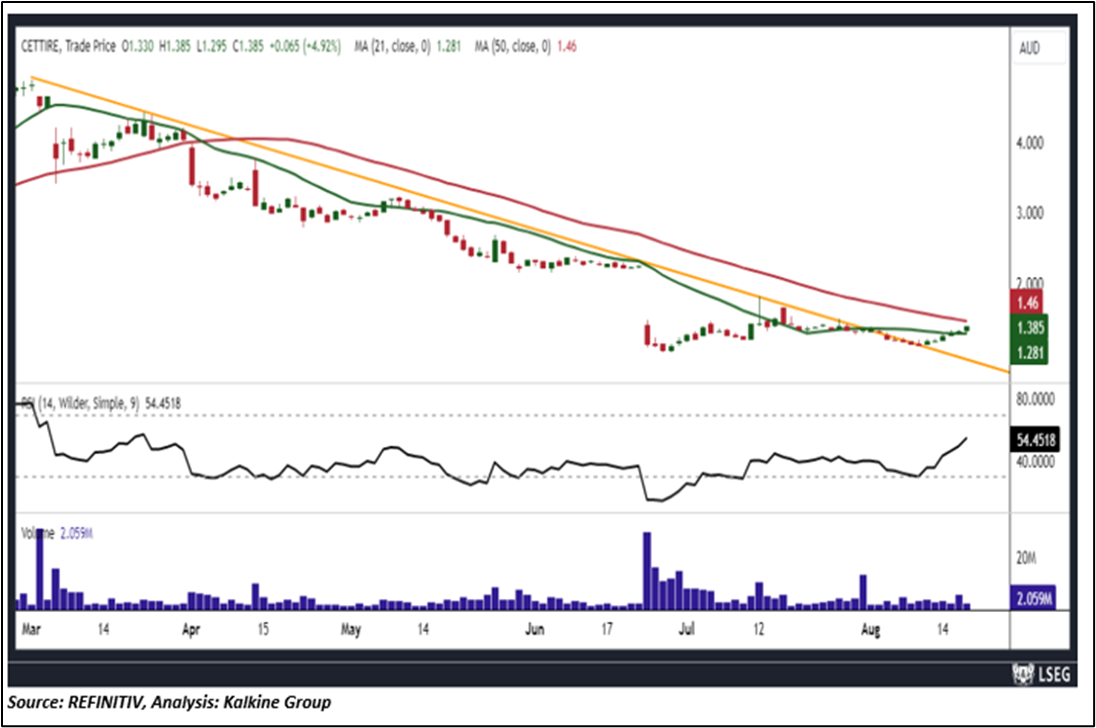
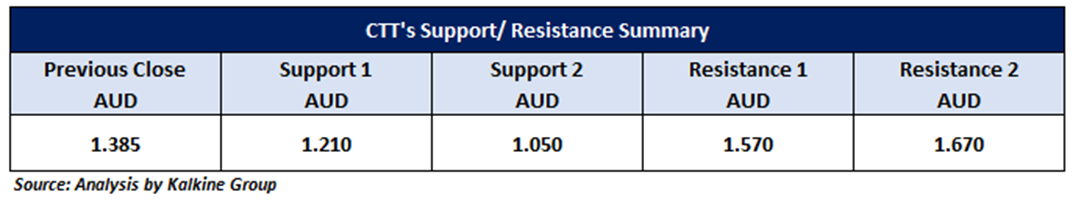
On the daily chart, CTT’s prices are sustaining above the falling trendline breakout level, indicating an upside movement. Since then, prices are continuously sustaining above the trendline support zone, indicating the possibility of a further upside hereon. Now the stock is heading toward its next resistance level at AUD 1.570 and in the short term (2-4 weeks), prices may test this level. An upside movement above the AUD 1.570 level supported by volumes may extend buying in the stock to the AUD 1.670 level.
Technical Indicators Analysis (On the Daily Chart)
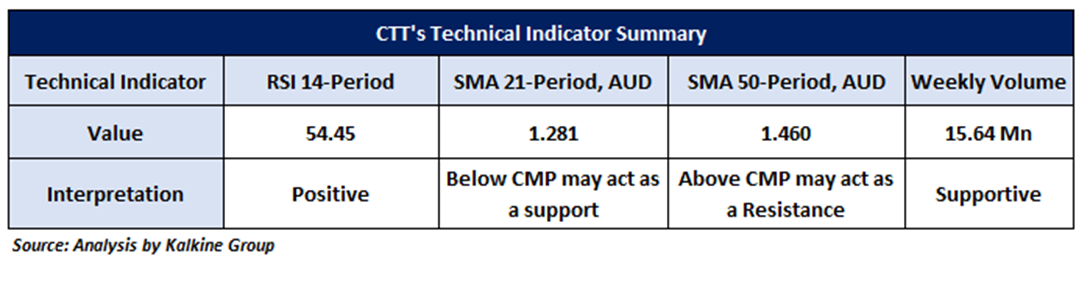
On the daily chart, RSI (14-period) is moving in a positive zone and showing a reading of ~54.45 level, indicating positive price momentum. Volume analysis shows a positive signal for stock prices. Moreover, the CMP is moving above the trend following indicator 21-period SMA, which may act as the support level.
General Recommendation:
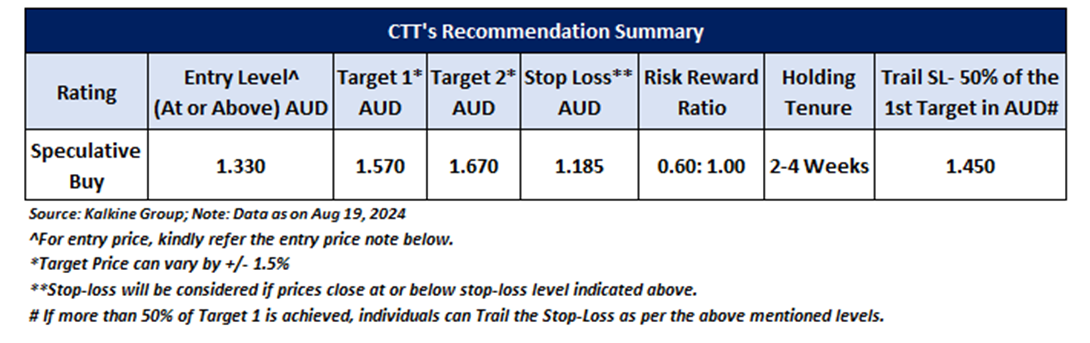
As per the above-mentioned price action and technical indicators analysis, Cettire Limited is looking technically well-placed on the chart, and a ‘Speculative Buy’ recommendation has been given on the stock. Investment decision should be made depending on an individual’s appetite for an upside potential, risks, and any previous holdings. This recommendation is purely based on technical indicator analysis, and fundamental analysis has not been considered in this report. Cettire Limited (ASX: CTT) was last covered in a report dated '23 July 2024'. Summary of recommendation is as follows:
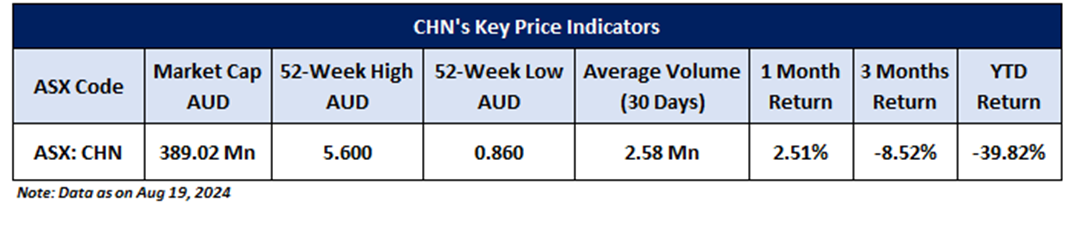
Chalice Mining Limited (ASX: CHN)
Noted below are the key price indicators for the stock:
Price Action Analysis (on the Daily Chart)
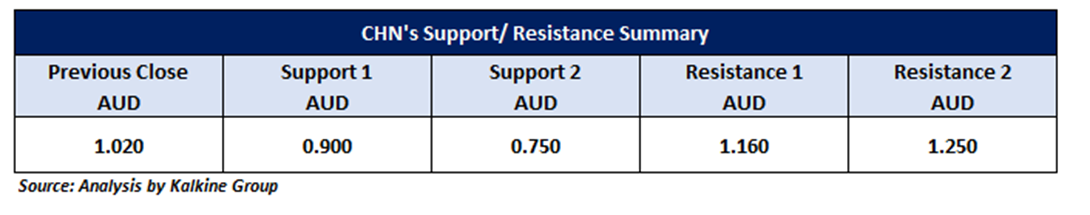
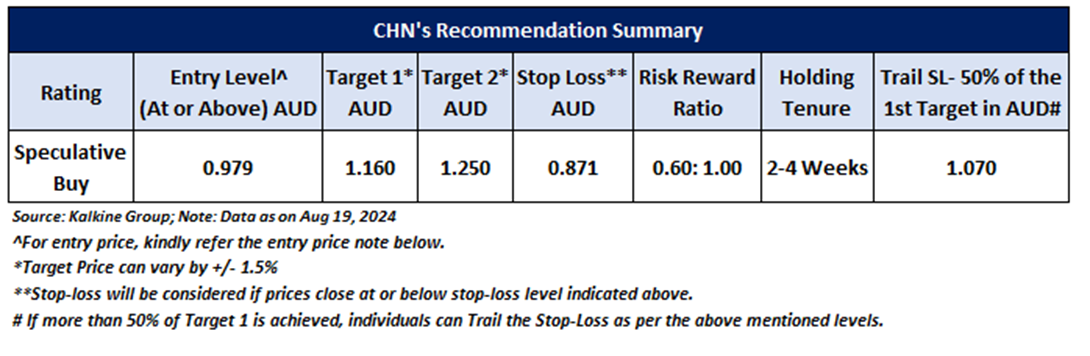
On the daily chart, CHN’s prices are trading above the horizontal trendline support level and continuously taking support from the trendline, indicating the possibility of a further upside hereon. Now the stock is heading toward its next resistance level at AUD 1.160 and in the short term (2-4 weeks), prices may test this level. An upside movement above the AUD 1.160 level supported by volumes may extend buying in the stock to the AUD 1.250 level.
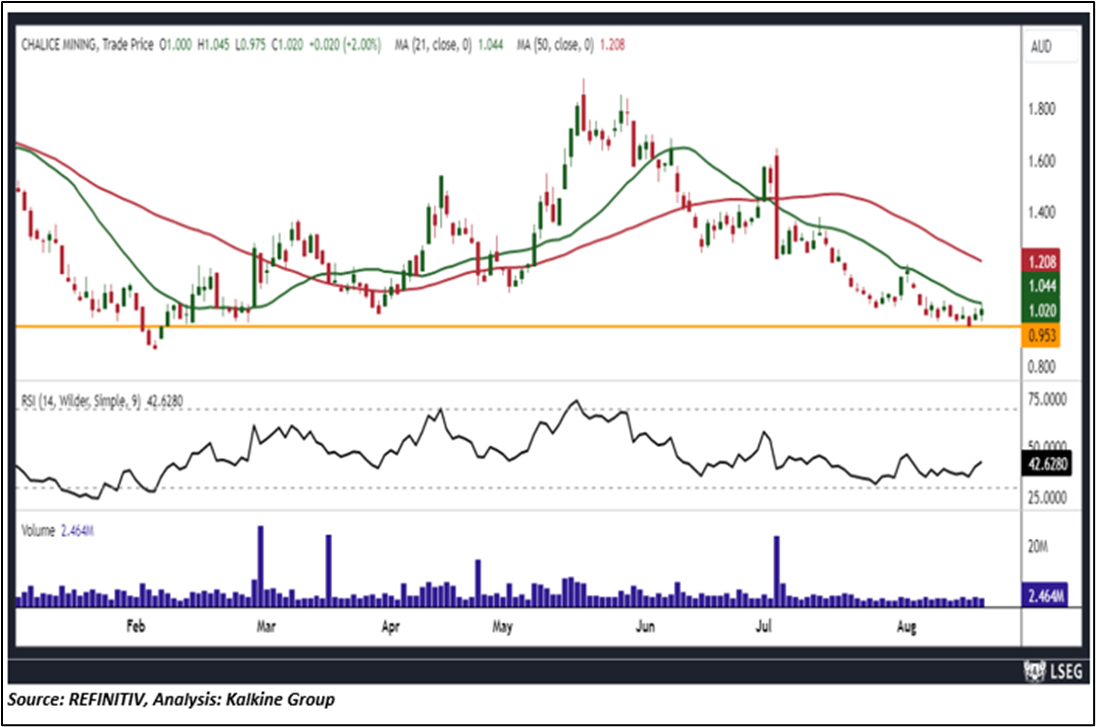
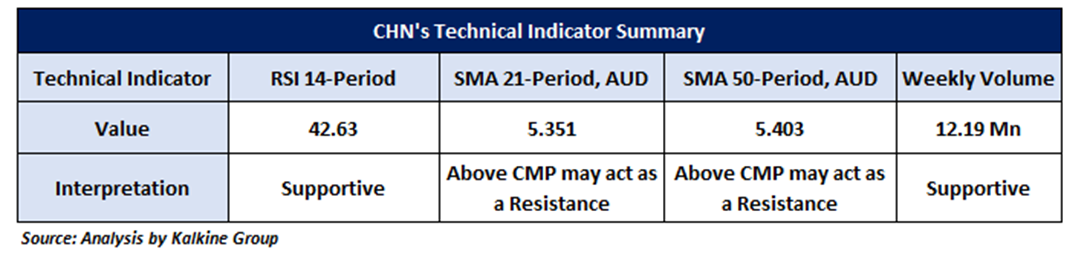
Technical Indicators Analysis (On the Daily Chart)
On the daily chart, RSI (14-period) is moving in a positive zone and showing a reading of ~42.63 level, indicating positive price momentum. Moreover, the weekly volumes also seem supportive of the upside movement. However, the CMP is trading below its 21-period SMA, which is acting as resistance for the stock.
General Recommendation:
As per the above-mentioned price action and technical indicators analysis, Chalice Mining Limited is looking technically well-placed on the chart, and a ‘Speculative Buy’ recommendation has been given on the stock. Investment decision should be made depending on an individual’s appetite for an upside potential, risks, and any previous holdings. This recommendation is purely based on technical indicator analysis, and fundamental analysis has not been considered in this report. Chalice Mining Limited (ASX: CHN) was last covered in a report dated '18 July 2024'. Summary of recommendation is as follows:
Markets are trading in a highly volatile zone currently due to certain macro-economic and prevailing geopolitical tensions. Therefore, it is prudent to follow a cautious approach while investing.
Upcoming Major Global Economic Events
Market events occur on a day-to-day basis depending on the frequency of the data and generally include update on employment, inflation, GDP, consumer sentiments, etc. Noted below are the upcoming week's major global economic events that could impact the ASX All-Ordinaries Index and listed stocks’ prices:
Related Risks: This report may be looked at from high-risk perspective and recommendations are provided are for a short duration. Recommendations provided in this report are solely based on technical parameters, and the fundamental performance of the stocks has not been considered in the decision-making process. Other factors which could impact the stock prices include market risks, regulatory risks, interest rates risks, currency risks, social and political instability risks etc.
Note 1: Past performance is not a reliable indicator of future performance.
Note 2:Individuals can consider exiting from the stock if the Target Price mentioned as per the technical analysis has been achieved and subject to the factors discussed above.
Note3: How to Read the Charts?
The Green colour line reflects the 21-period moving average while the red line indicates the 50-period moving average. SMA helps to identify existing price trend. If the prices are trading above the 21-period and 50-period moving average, then it shows prices are currently trading in a bullish trend.
The Black colour line in the chart’s lower segment reflects the Relative Strength Index (14-Period) which indicates price momentum and signals momentum in trend. A reading of 70 or above suggests overbought status while a reading of 30 or below suggests an oversold status.
The Blue colour bars in the chart’s lower segment show the volume of the stock. The volume is the number of shares that changed hands during a given day. Stocks with high volumes are more liquid than stocks with lesser volume. Liquidity in stocks helps in easier and faster execution of the order.
The Orange colour lines are the trend lines drawn by connecting two or more price points and used for trend identification purposes. The trend line also acts as a line of support and resistance.
Technical Indicators Defined: -
Support: A level at which the stock prices tend to find support if they are falling, and a downtrend may take a pause backed by demand or buying interest. Support 1 refers to the nearby support level for the stock and if the price breaches the level, then Support 2 may act as the crucial support level for the stock.
Resistance: A level at which the stock prices tend to find resistance when they are rising, and an uptrend may take a pause due to profit booking or selling interest. Resistance 1 refers to the nearby resistance level for the stock and if the price surpasses the level, then Resistance 2 may act as the crucial resistance level for the stock.
Stop-loss: It is a level to protect further losses in case of unfavourable movement in the stock prices.
Risk Reward Ratio: Risk reward ratio is the difference between an entry point to a stop loss and profit level. This report is based on ~60% Stop Loss of the Target 1 from the entry point.
A trailing stop-loss is a modification of stop-loss in case of favourable movement in the price to protect the gains. Individuals can Trail the Stop-Loss as per the aforementioned levels if the stock price achieves more than 50% of the Target 1.Individuals should consider exiting from the position as per the Trailing Stop-Loss level if the price starts moving downwards after achieving more than 50% of the Target 1.
The reference date for all price data, currency, technical indicators, support, and resistance levels is August 19, 2024. The reference data in this report has been partly sourced from REFINITIV.
Abbreviations
CMP: Current Market Price
SMA: Simple Moving Average
AUD: Australian Dollar
RSI: Relative Strength Index
Note: Trading decisions require a thorough analysis by individuals. Technical reports in general chart out metrics that may be assessed by individuals before any stock evaluation. The above are illustrative analytical factors used for evaluating the stocks; other parameters can be looked at along with additional risks per se. Past performance is neither an indicator nor a guarantee of future performance.
Disclaimer This report has been issued by Kalkine New Zealand Limited (FSP691351) (NZBN:9429047678101) (“Kalkine”). Kalkine is a Financial Advice Provider (“FAP”) and is authorised by a Class 1 Financial Advice Provider Licence issued by Financial Markets Authority (“FMA”) to provide financial advice. Kalkine provides only general financial advice through its research reports following a person becoming a member. The reports contain buy/sell/hold and other recommendations in relation to equity securities, managed funds and other managed investment schemes and other financial advice products. The recommendations and opinions in this report and on Kalkine website do not take into account any of your investment objectives, financial situation or needs. Before you make a decision about whether to acquire a financial product, you should obtain the Product Disclosure Statement from the product issuer. You should consider the appropriateness of advice taking into account your own objectives, financial situation and needs and seek independent financial advice before making any financial decisions. If you act on the advice in the research reports, you may have to pay fees, expenses or other amounts (but not to Kalkine). Further information about the complaints and dispute resolution process, as well as information about Kalkine’s duties are available on Kalkine’s website. Please read our Financial Advice Provider (FAP) disclosure statement and Complaints Handling Guide, which are available on the website.
Past performance is not a reliable indicator of future performance.
 Please wait processing your request...