
I. Sector Landscape and Outlook
As per the Ministry of Business, Innovation and Employment (MBIE), the net generation increased to 11,817 GWh in September 2022 quarter from 11,597 GWh in September 2021 quarter, up 1.9% YoY. This rise was driven by the increase in Wind energy, which stood at 772 GWh (up 7.1% YoY), Hydro energy, which stood at 7,463 GWh (up 10.7% YoY), and Solar energy, which stood at 62 GWh (up 34.6% YoY) for the same period.
NZ is utilizing the system of emissions budgets to determine the pathway for 2050 targets of net zero long-lived greenhouse gas emissions and a fall in biogenic methane emissions. On 16 May 2022, the Government released New Zealand’s first Emissions Reduction Plan (ERP), which detailed the strategies, policies, and actions for the country’s first emissions budget (covering 2022 to 2025). Meanwhile, residential consumption is expected to grow, primarily driven by electricity and natural gas use. Further, the energy consumption for transport is growing post-quarantine-free travel.
Renewable Share in Electricity Generation Gaining Traction
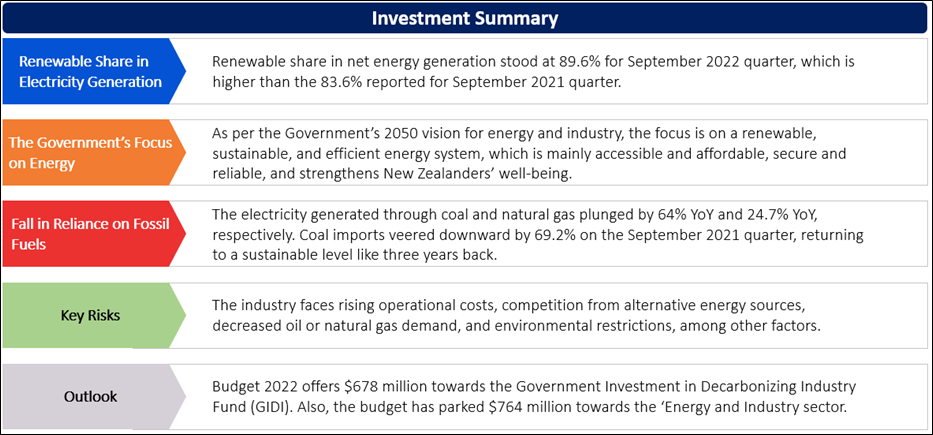
As per MBIE, renewable share in net energy generation stood at 89.6% for September 2022 quarter, which is higher than the 83.6% reported for September 2021 quarter. Due to the gaining momentum for renewable energy, the renewable share four-quarter moving average increased to 86.1% for September 2022 quarter, the highest percentage share since March 2018 quarter. Solar energy generation increased 34.6% YoY, and Wind energy generation increased 7.1% YoY in September 2022 quarter. Due to the widespread generation capacity of Wind energy, the industry accounts for ~5% of New Zealand’s electricity generation. Energy generation from wind is the highest on record in September 2022 quarter as the wind farm at Turitea North is completely online.
Exhibit 1: Trend in Renewable Share (%) in Net Energy Generation – Since March 2018 Quarter
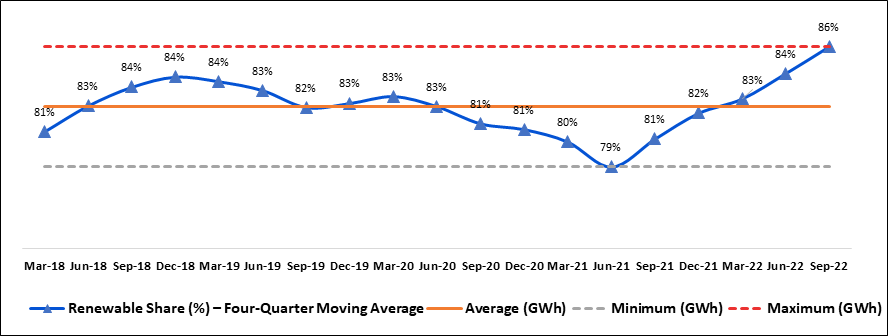
Data Source: This work is owned by the Ministry of Business, Innovation and Employment on behalf of the Crown which are licensed for reuse under the Creative Commons Attribution 4.0 International Licence; Chart Created by Kalkine Group
The Government’s Focus on Energy – 100% Renewable Electricity by 2030
Energy use is increasing in transport, household electricity, heating, and industries and plays a vital role in the health and wellness of people, communities, and livelihoods. As per MBIE, in 2020, emissions from energy contributed 40% of total gross emissions. As per the Government’s 2050 vision for energy and industry, the focus is on a renewable, sustainable, and efficient energy system, which is mainly accessible and affordable, secure and reliable, and strengthens New Zealanders’ well-being. The Government aims to reach net zero for long-lived gases by 2050, where 50% of total energy consumption is expected to come from renewable sources by 2035 and aspires to 100% renewable electricity by 2030.
Exhibit 2: Trend in Major Energy Contributor to Net Generation in New Zealand Since March 2018 Quarter
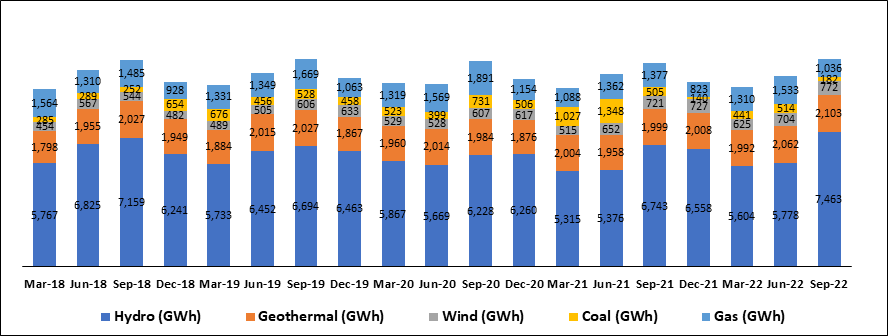
Data Source: This work is owned by the Ministry of Business, Innovation and Employment on behalf of the Crown which are licensed for reuse under the Creative Commons Attribution 4.0 International Licence; Chart Created by Kalkine Group
Fall in Reliance on Fossil Fuels for Electricity Generation in September 2022 Quarter
As per MBIE, electricity generated through coal and natural gas plunged by 64% YoY and 24.7% YoY, respectively, where coal imports veered downward by 69.2% on the September 2021 quarter, returning to a sustainable level like three years back. In September 2022, NZ imported sustainable aviation fuel, the first time NZ has done so. Amid the rise in air traffic, Jet Fuel used air services grew by 74% YoY in September 2022 quarter, but still 56% lower than the level seen in September quarter 2019.
Index Performance:
The S&P/NZX All Utilities (Sector) Index generated a 5-year return of ~105.36% versus ~38.77% by the S&P/NZX 50 Index. Therefore, NZX All Utilities Index overperformed NZX50 Index by ~66.59% in 5-year.
Exhibit 3: S&P/NZX All Utilities (Sector) vs S&P/NZX50 Index
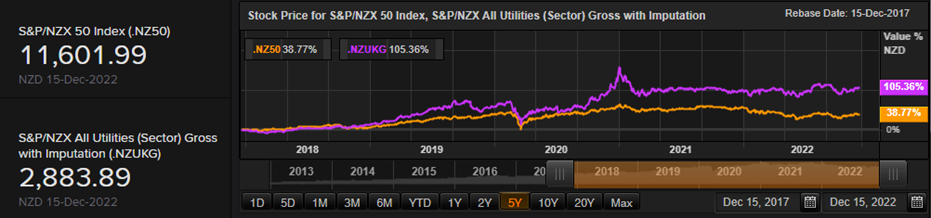
Source: REFINITIV
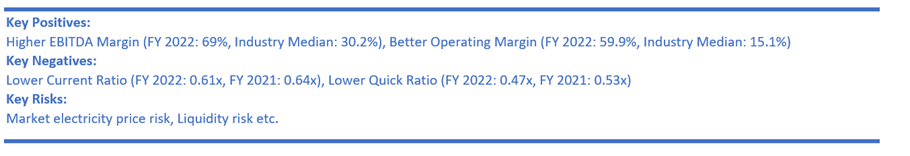
Key Risks and Challenges:
The government and private players are working together to support low-carbon electricity systems, a complex collaboration of multiple technologies with strategic functions to maximize output. Further, the uncertainty over the availability of raw materials used in renewable electricity generation implies an option value associated with the choice between future non-fossil-fuel generation and fossil-fuel technologies. In line with this, the power sector is also susceptible to drastic changes in the climate suitable for energy generation. Rising water temperature, air temperature, and frequency/intensity of droughts are prospective circumstances that could impact the generation efficiency of hydropower generation and nuclear power plants.
Exhibit 4. Key Risks in Utilities Sector:
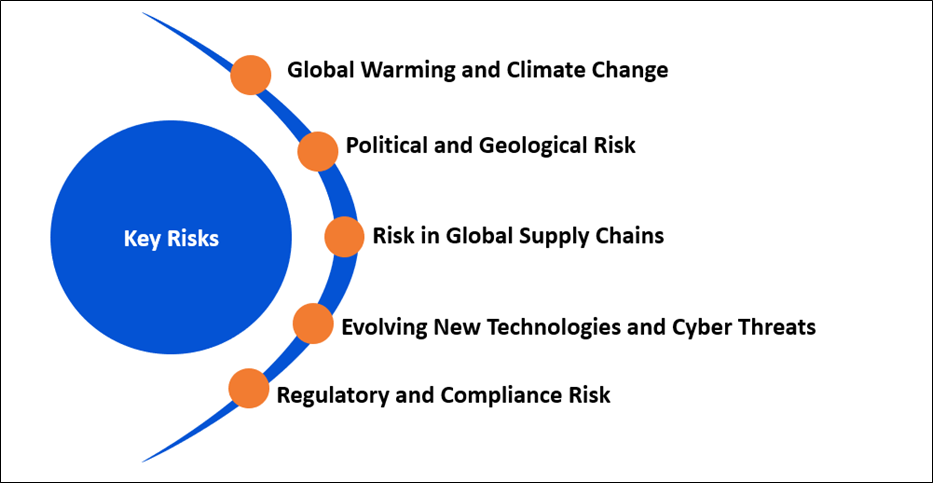
Source:- Analysis: Kalkine Group
Outlook:
As per Stats.NZ measured by GDP, NZ economic activity increased by 2.0% in the September 2022 quarter, following a 1.9% rise reported in June 2022. In this, expenditure on GDP grew by 2.0%, service industries increased by 2.0%, and goods-producing industries increased by 2.4%, while primary industries decreased by 0.2% and GDP per capita increased by 1.9%. GDP grew 2.7% over the year ended September 2022 versus the year ended September 2021.
Back home in NZ, the Government is focusing on renewable energy sources to reach the target of 50% of total energy consumption coming from renewable sources by 2035. The current contribution by solar energy towards energy supply is low, making below 0.5% of electricity generation and 0.2% of final energy consumption. However, this number is increasing as residential installations are increasing. Multiple firms are focusing on development opportunities in utility-scale solar. Budget 2022 offers $678 million towards the Government Investment in Decarbonising Industry Fund (GIDI). Also, the budget has parked $764 million towards the ‘Energy and Industry sector’, primarily for industrial decarbonization push and efforts to support the broader energy transition, a way towards the direction of energy independence.
Apart from the sector-specific factors, an analysis on two NZX-listed companies is provided. This report covers their insights, outlook, performance and potential as expected to be delivered in the near to medium term.
1) Contact Energy Limited (Recommendation: Buy, Potential Upside: Low Double-Digit) (M-Cap: NZD6.1 billion, Annual Dividend Yield (TTM) 1: 6.00%)
Business Description:
Contact Energy Limited (NZX: CEN) is involved in providing electricity, natural gas, and liquefied petroleum gas (LPG), along with broadband services. The electricity is generated through thermal, hydro, and geothermal sources.
Outlook:
The company is committed to leading the decarbonisation of NZ. CEN has the clear strategy, robust balance sheet as well as several opportunities to lead the decarbonisation of the NZ economy. Notably, the demand for renewable electricity from forward-thinking customers is robust. The company has secured long-term power purchase agreements to supply Oji Fibre, Pan Pac, Genesis Energy and Foodstuffs with renewable electricity. The long-term contracts underpin sustainable operations, help in additional renewable generation development as well as could also displace thermal generation.
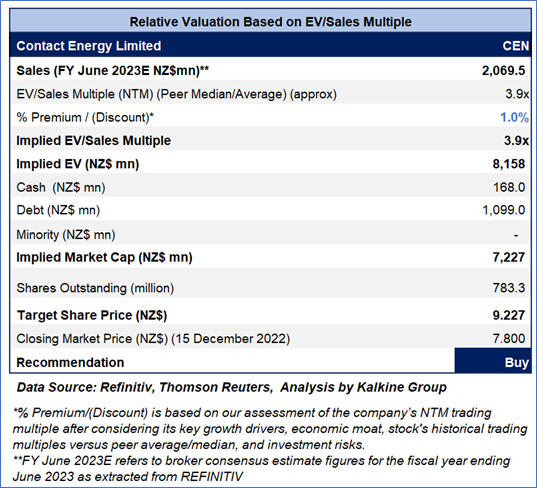
Valuation Methodology: EV/Sales Multiple Based Relative Valuation (Illustrative)
Technical Overview:
Daily Price Chart
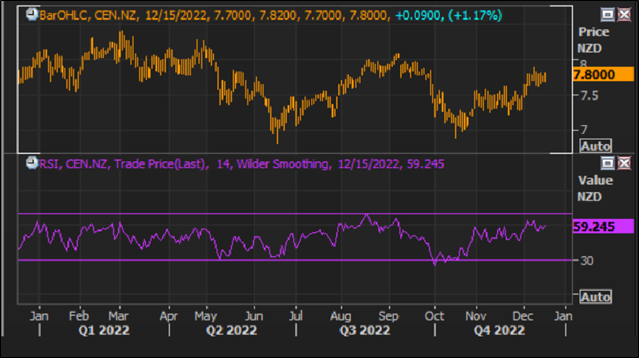
Source: REFINITIV, Note: Purple color line reflects Relative Strength Index (14-Period)
Commentary:
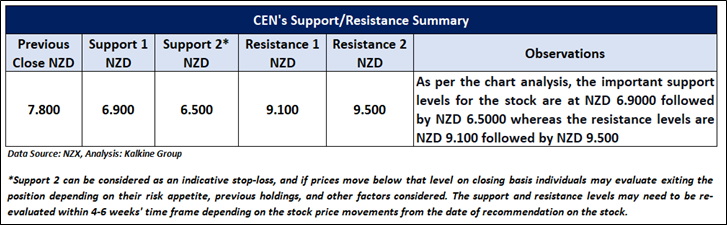
On the daily chart, CEN stock prices started to move upside after taking support from the horizontal support line and are sustaining above the same from the past few trading sessions. The momentum oscillator RSI (14-period) is moving in a positive zone and is showing a reading of ~59.245 level, indicating the possibility of an upside reversal hereon. An important support level for the stock is placed at NZD6.90 and NZD6.500 while the key resistance level is placed at NZD9.1 and NZD9.5
Stock Recommendation
The stock has been valued using EV/Sales multiple-based illustrative relative valuation, and the target price so arrived reflects a rise of low double-digit (in % terms). A slight premium has been applied to EV/Sales multiple (NTM) (Peer Average) considering the decent outlook as well as reaffirmation of its guidance range.
Considering the facts above, a ‘Buy’ recommendation on the stock has been provided at the closing market price of NZ$7.80 per share, up by 1.17% as on 15th December 2022.
2) NZ Windfarms Limited (Recommendation: Speculative Buy, Potential Upside: Low Double-Digit) (M-Cap: NZD44.6 million, Annual Dividend Yield (TTM)1: 2.38%)
Business Description:
NZ Windfarms Limited (NZX: NWF) is a long-term specialist wind farm owner and operator.
Outlook:
NWF has reaffirmed its guidance range of estimated EBITDAF of $5.0 Mn - $6.5 Mn. The company announced an unimputed Q1 FY 2023 dividend of $0.0005 per share. The Board took prudent approach to maintain increased cash levels in order to cover expected costs from repower consenting as well as feasibility workstreams. NWF’s dividend policy provides for the quarterly dividends of 70% - 100% of free cash flow.
Technical Overview:
Daily Price Chart
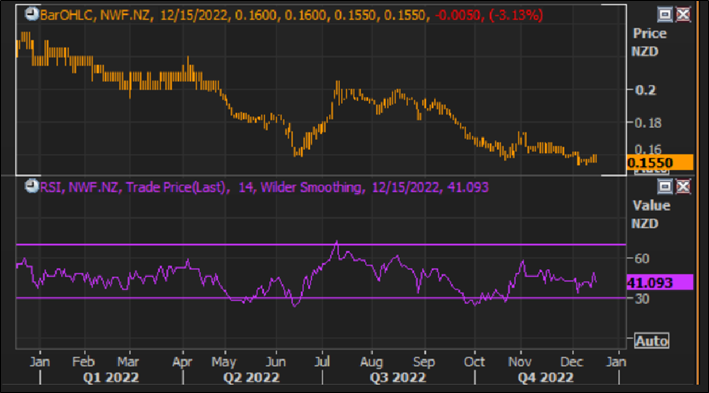
Source: REFINITIV, Note: Purple color line reflects Relative Strength Index (14-Period)
Technical Commentary:
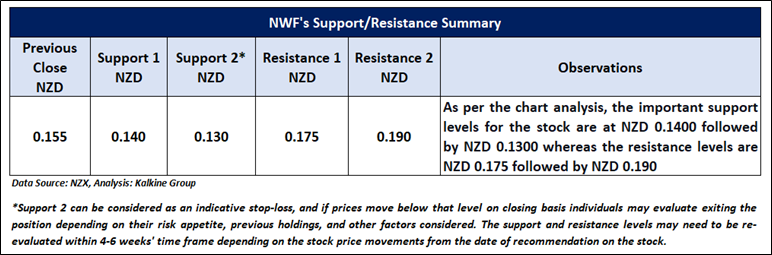
On the daily chart, NWF stock prices are consolidating around the crucial support zone and are sustaining above the same from the past few trading sessions, indicating the possibility of an upside reversal hereon. The momentum oscillator RSI (14-period) is moving below the midpoint and is showing a reading of ~41.093 level. An important support level for the stock is placed at NZD0.140 and NZD0.130 while the key resistance level is placed at NZD0.175 and NZD0.190.
Stock Recommendation
Considering the facts above, a ‘Speculative Buy’ recommendation on the stock has been provided at the closing price of NZ$0.155 per share, down by 3.13% as on 15th December 2022.
Markets are trading in a highly volatile zone currently due to certain macro-economic issues and geopolitical tensions prevailing. Therefore, it is prudent to follow a cautious approach while investing.
Note 1: Past performance is neither an indicator nor a guarantee of future performance.
Note 2: The reference date for all price data, currency, technical indicators, support, and resistance levels is December 15, 2022. The reference data in this report has been partly sourced from REFINITIV.
Note 3: Investment decisions should be made depending on an individual's appetite for upside potential, risks, holding duration, and any previous holdings. An 'Exit' from the stock can be considered if the Target Price mentioned as per the Valuation and or the technical levels provided has been achieved and is subject to the factors discussed above.
Note 4: Annual Dividend Yield is on a Trailing Twelve Month (TTM1) basis and are subject to change based on factors such as company performance, stock price changes, etc.
Technical Indicators Defined: -
Support: A level at which the stock prices tend to find support if they are falling, and a downtrend may take a pause backed by demand or buying interest. Support 1 refers to the nearby support level for the stock and if the price breaches the level, then Support 2 may act as the crucial support level for the stock.
Resistance: A level at which the stock prices tend to find resistance when they are rising, and an uptrend may take a pause due to profit booking or selling interest. Resistance 1 refers to the nearby resistance level for the stock and if the price surpasses the level, then Resistance 2 may act as the crucial resistance level for the stock.
Stop-loss: It is a level to protect further losses in case of unfavourable movement in the stock prices.
Disclaimer
Kalkine New Zealand Limited is a Financial Advice Provider (“FAP”) and is authorised by a Transitional FAP license issued by Financial Markets Authority (“FMA”) to provide financial advice. Kalkine provides only general financial advice through its research reports following a person becoming a member. The reports contain buy/sell/hold and other recommendations in relation to equity financial products. The recommendations and opinions [on this website] / [in this report] do not take into account any of your investment objectives, financial situation or needs. Before you make a decision about whether to acquire a financial product, you should obtain the Product Disclosure Statement from the product issuer. You should consider the appropriateness of advice taking into account your own objectives, financial situation and needs and seek independent financial advice before making any financial decisions. If you act on the advice in the research reports, you may have to pay fees, expenses or other amounts (but not to Kalkine). Further information about the complaints and dispute resolution process, as well as information about Kalkine’s duties are available on Kalkine’s website. Please read our Financial Advice Provider (FAP) disclosure statement and Complaints Handling Guide, which are available on the website.
Past performance is not a reliable indicator of future performance.
 Please wait processing your request...