
1. Sector Landscape and Outlook
The international visitor numbers for September 2022 indicated promising momentum for the future, providing strength to the tourism industry, while a decline in the net migration loss demonstrates that more people are willing to stay in NZ. A similar pattern was seen between 2002 and the start of the COVID-19 pandemic, where NZ had an annual net loss of NZ citizens and an annual net gain of non-NZ citizens. The revival in international visitors is a positive sign for the NZ economy as the tourism sector is a crucial contributor towards GDP. Before COVID-19, tourism was NZ's largest export industry, providing $40.9 billion to the country. Tourism offers direct employment to ~8.4% (229,566 people) of the NZ workforce. Meanwhile, the Reserve Bank of New Zealand (RBNZ) increased the OCR by 75 basis points (bps), the single most significant jump, indicating a higher-than-expected OCR peak next year, leading to a contraction. Effective retail sales and consistent inflationary pressures mean the underlying strength of demand in the economy, driven by consumption, despite decreasing house prices and pessimistic business confidence.
GDP Increases 1.7% in June 2022 Quarter, Primarily Driven by the Services Industries
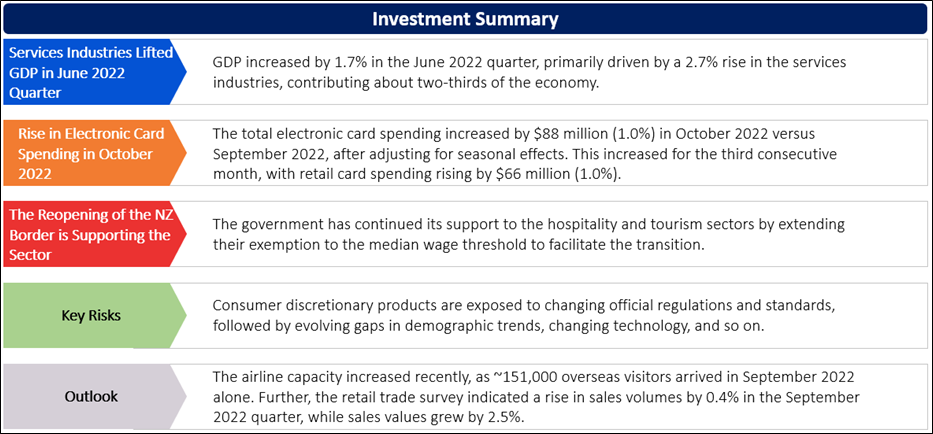
As per Stats.NZ, Gross domestic product (GDP) increased by 1.7% in the June 2022 quarter, following a 0.2% fall in the March 2022 quarter. The rise in GDP in the June quarter was primarily driven by a 2.7% rise in the services industries, contributing about two-thirds of the economy. The reopening of borders in phases, easing of domestic as well as international travel restrictions, and lesser domestic restrictions under the ‘Orange traffic light system’ (Earlier, the Red traffic light system was followed) boosted industries that were impacted by COVID-19. In the June 2022 quarter, households and international visitors coming to NZ spent on transport, accommodation, eating out, and sports and recreational activities.
Exhibit 1: Trend in Quarterly growth (%) (March 2015–June 2022)
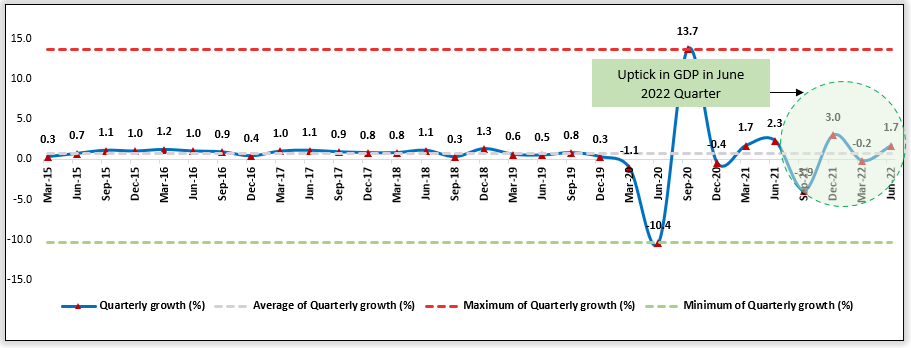
Data Source: This work is based on/includes Stats NZ’s data which are licensed by Stats NZ for reuse under the Creative Commons Attribution 4.0 International Licence; Chart Created by Kalkine Group
Rise in Electronic Card Spending in October 2022
As per Stats.NZ, the total electronic card spending increased by $88 million (1.0%) in October 2022 versus September 2022, after adjusting for seasonal effects. This increased for the third consecutive month, with retail card spending rising by $66 million (1.0%). From the industry perspective, the durables industry grew by $46 million (up 2.8%), and the consumables Industry grew by $23 million (up 0.9%) in October 2022 versus September 2022. Durables include furniture, hardware, and appliances, while consumables include groceries, supermarkets, and liquor. October 2022 is the first month to reflect rising spending across all categories since May 2022.
Exhibit 2: Shift in Seasonally Adjusted Card Transaction Values by Industry ($’mn), September 2022–October 2022
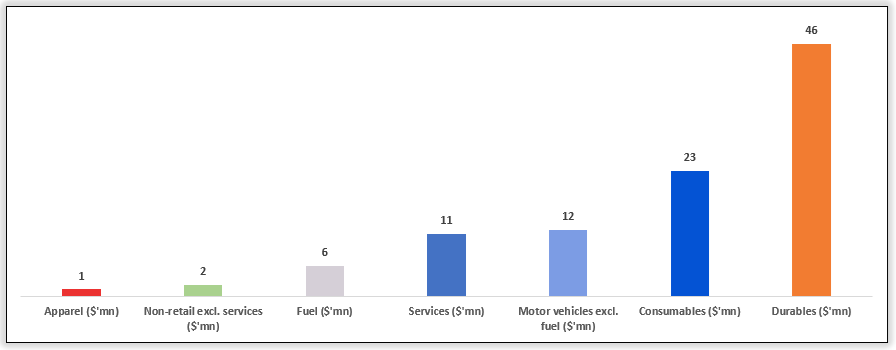
Data Source: This work is based on/includes Stats NZ’s data which are licensed by Stats NZ for reuse under the Creative Commons Attribution 4.0 International Licence; Chart Created by Kalkine Group
The Reopening of the NZ Border is Supporting Hospitality and Tourism Sector
As per Immigration, the government has continued its support to the hospitality and tourism sectors by extending their exemption to the median wage threshold to facilitate the transition. Multiple tourism and hospitality businesses can now hire migrants on a reduced wage threshold set by the government’s temporary median wage exception policy, which is extended for another year, from 2023 to 2024. The government is focusing on transforming NZ into a higher-wage economy, raising the skill level of migrant workers, and persuading employers to offer competitive wages and improve career pathways for New Zealanders.
Index Performance:
The S&P/NZX All Consumer Discretionary Index generated a 2-year return of ~-8.67% versus ~-10.11% by the S&P/NZX 50 Index. Therefore, S&P/NZX All Consumer Discretionary Index overperformed S&P/NZX 50 Index by ~1.44% in 2-year.
Exhibit 3: S&P/NZX All Consumer Discretionary Index vs S&P/NZX 50 Index
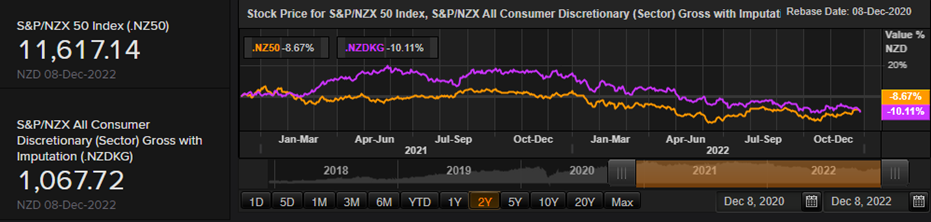
Source: REFINITIV
Key Risks and Challenges:
The retail and consumer sector are facing high competition from domestic and international tech-savvy e-commerce businesses, new brands and stores, thereby shaking the footprints of the established brands. Due to the shift in consumer preferences and tastes, retail and consumer sector companies are adapting to new advancements, demanding higher working capital requirements, and compressing the bottom-line performance. Another challenge the industry faces is the management of inventory levels and SKUs, as the demand for uniqueness is growing in the market. Meanwhile, consumer price inflation has increased well above the comfort level due to higher energy prices amid geopolitical tensions, supply chain disruptions and a tight workforce.
Exhibit 4. Key Risks in Retail & Consumer Sector:
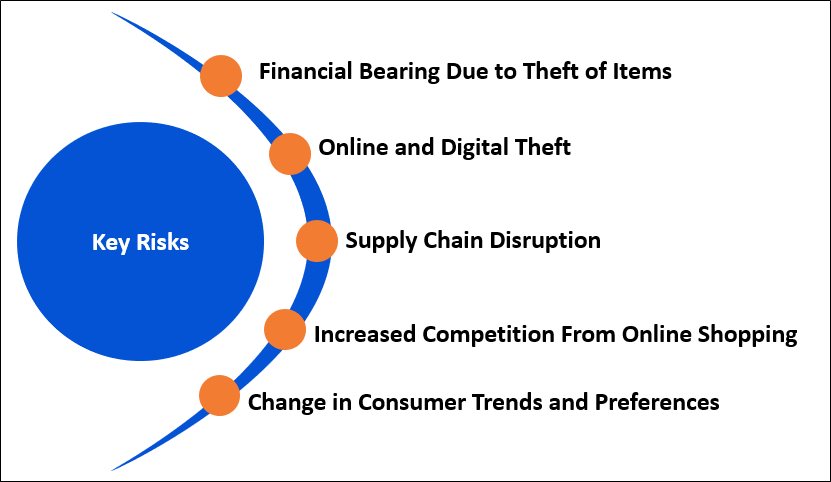
Source: Analysis by Kalkine Group
Outlook:
Spending by international visitors crossed the $1.0 billion mark in the September 2022 quarter, and tourism electronic card transactions in 8 of 16 NZ regions were higher than in October 2019. The momentum in the tourism sector is well supported by multiple government initiatives like the $400 million Tourism Recovery Package, the $200 million Tourism Communities Plan, and the $54 million Innovation Programme. Further, the airline capacity increased recently, as ~151,000 overseas visitors arrived in September 2022 alone. Moreover, the retail trade survey indicated a rise in sales volumes by 0.4% in the September 2022 quarter, while sales values grew by 2.5%. As per Treasury.NZ, consumer spending is anticipated to ease by the end of 2022 as macro headwinds gather and monetary policy tightening accelerates.
Apart from the sector-specific factors, an analysis on two NZX-listed companies is provided. This report covers their insights, outlook, performance and potential as expected to be delivered in the near to medium term.
1) SkyCity Entertainment Group Limited (Recommendation: Buy, Potential Upside: Low Double-Digit) (M-Cap: NZD2.01 billion, Annual Dividend Yield (TTM)1: 3.61%)
Business Description:
SkyCity Entertainment Group Limited (NZX: SKC) operates integrated entertainment complexes having casino gaming facilities and premium restaurants and bars.
Outlook:
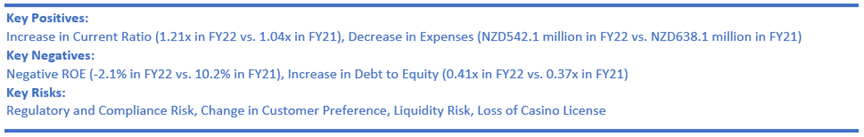
SKC is hopeful of returning to pre-COVID-19 earnings in FY2023, driven by ongoing recovery of local gaming, optimising SkyCity Adelaide post-expansion, reopening of international borders and cost management. Further, the company reiterated its existing dividend policy of paying 60-90% of normalised NPAT per annum.
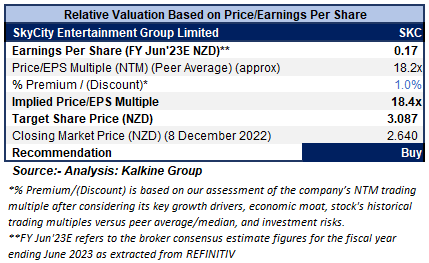
Valuation Methodology: Price/Earnings Per Share Based Relative Valuation (Illustrative)
Technical Overview:
Daily Price Chart
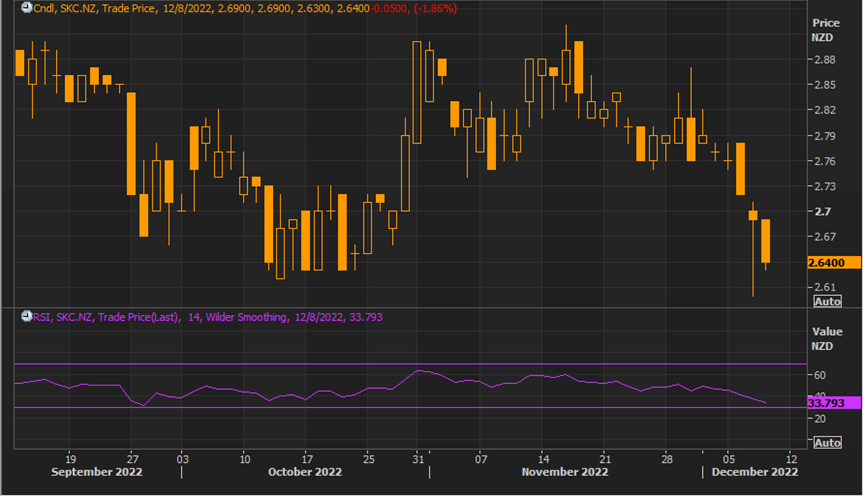
Source: REFINITIV, Note: Purple color line reflects Relative Strength Index (14-Period)
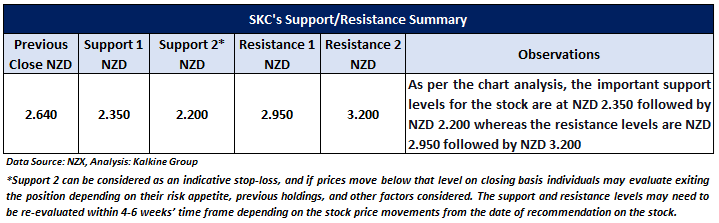
Stock Recommendation
The stock has been valued using P/E multiple-based illustrative relative valuation, and the target price so arrived reflects a rise of low double-digit (in % terms). A slight premium has been applied to P/E Multiple (NTM) (Peer Average), considering its healthy start to FY2023, balance sheet strength, and decent outlook.
Considering the facts above, a ‘Buy’ recommendation on the stock has been provided at the closing market price of NZD2.64 per share, down 1.86% as of 8 December 2022.
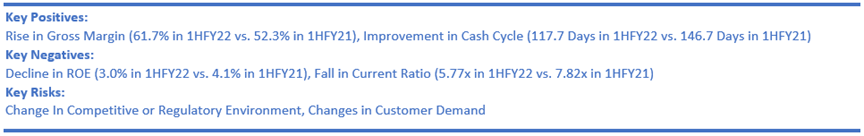
2) Millennium & Copthorne Hotels New Zealand Limited (Recommendation: Hold, Potential Upside: Low Double-Digit) (M-Cap: NZD203.57 million, Annual Dividend Yield (TTM)1: 2.52%)
Business Description:
Millennium & Copthorne Hotels New Zealand Limited (NZX: MCK) is engaged in the hotel and resort business and building residential properties.
Outlook:
The company anticipates that its hotel operations will be under pressure due to macroeconomic factors. However, the company is determined to ensure that it utilizes the current period in its best interest. It believes in reinvesting in properties during the coming months and years to ensure adequate performance at its best when the market condition recovers and international travel, in particular, gains strengths.
Technical Overview:
Daily Price Chart
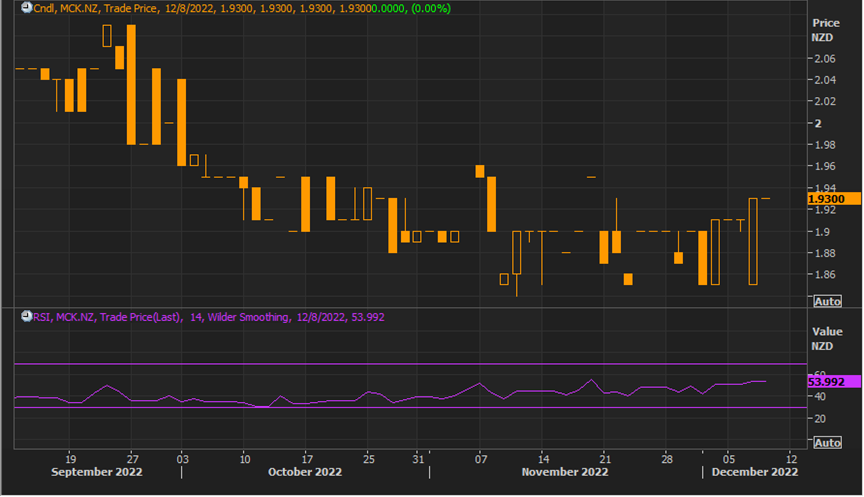
Source: REFINITIV, Note: Purple color line reflects Relative Strength Index (14-Period)
Technical Commentary
On the daily chart, MCK's stock prices started to move upside after taking support from the crucial support zone and trading above the support level from the past few trading sessions. Moreover, the momentum oscillator RSI (14-period) is moving above the midpoint and showing a reading of ~53.992 level, indicating the possibility of an upside rebound hereon. An important support level for the stock is placed at NZD1.75 while the key resistance level is placed at NZD2.10.
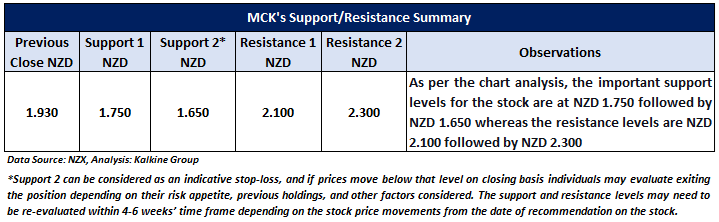
Stock Recommendation
Considering the facts above, a ‘Hold’ recommendation on the stock has been provided at the closing market price of NZD1.93 per share, as of 8 December 2022.
Markets are trading in a highly volatile zone currently due to certain macro-economic issues and geopolitical tensions prevailing. Therefore, it is prudent to follow a cautious approach while investing.
Note 1: Past performance is not a reliable indicator of future performance.
Note 2: The reference date for all price data, currency, technical indicators, support, and resistance levels is December 8, 2022. The reference data in this report has been partly sourced from REFINITIV.
Note 3: Investment decisions should be made depending on an individual's appetite for upside potential, risks, holding duration, and any previous holdings. An 'Exit' from the stock can be considered if the Target Price mentioned as per the Valuation and or the technical levels provided has been achieved and is subject to the factors discussed above.
Note 4: Annual Dividend Yield is on a Trailing Twelve Month (TTM1) basis and are subject to change based on factors such as company performance, stock price changes, etc.
Technical Indicators Defined: -
Support: A level at which the stock prices tend to find support if they are falling, and a downtrend may take a pause backed by demand or buying interest. Support 1 refers to the nearby support level for the stock and if the price breaches the level, then Support 2 may act as the crucial support level for the stock.
Resistance: A level at which the stock prices tend to find resistance when they are rising, and an uptrend may take a pause due to profit booking or selling interest. Resistance 1 refers to the nearby resistance level for the stock and if the price surpasses the level, then Resistance 2 may act as the crucial resistance level for the stock.
Stop-loss: It is a level to protect further losses in case of unfavourable movement in the stock prices.
Disclaimer
Kalkine New Zealand Limited is a Financial Advice Provider (“FAP”) and is authorised by a Transitional FAP license issued by Financial Markets Authority (“FMA”) to provide financial advice. Kalkine provides only general financial advice through its research reports following a person becoming a member. The reports contain buy/sell/hold and other recommendations in relation to equity financial products. The recommendations and opinions [on this website] / [in this report] do not take into account any of your investment objectives, financial situation or needs. Before you make a decision about whether to acquire a financial product, you should obtain the Product Disclosure Statement from the product issuer. You should consider the appropriateness of advice taking into account your own objectives, financial situation and needs and seek independent financial advice before making any financial decisions. If you act on the advice in the research reports, you may have to pay fees, expenses or other amounts (but not to Kalkine). Further information about the complaints and dispute resolution process, as well as information about Kalkine’s duties are available on Kalkine’s website. Please read our Financial Advice Provider (FAP) disclosure statement and Complaints Handling Guide, which are available on the website.
Past performance is not a reliable indicator of future performance.
 Please wait processing your request...