
One NYSE-Listed Packaging Stock with Decent Fundamentals: AptarGroup Inc
Section 1: Company Overview and Fundamentals
1.1 Company Overview:
AptarGroup, Inc. (NYSE: ATR) is engaged in designing and manufacturing of drug and consumer product dosing, dispensing and protection technologies. The Company serves various end markets, including pharmaceutical, beauty, food, beverage, personal care and home care. It operates in three segments.
Kalkine’s Low Carbon Research Report covers the Investment Highlights, Low Carbon Emission Initiatives, Key Financial Metrics, Risks, and Technical Analysis along with the Valuation, Target Price, and Recommendation on the stock.
Stock Performance:

1.2 Why do Low Carbon Emissions matter?
The shift toward a low-carbon economy is one of the most significant challenges of current time, spurred by the urgent need to combat climate change and reduce the environmental impact of corporate activities. This report covers the US-listed low-carbon emission company (NYSE: ATR), that is committed to sustainability and responsible environmental practices.

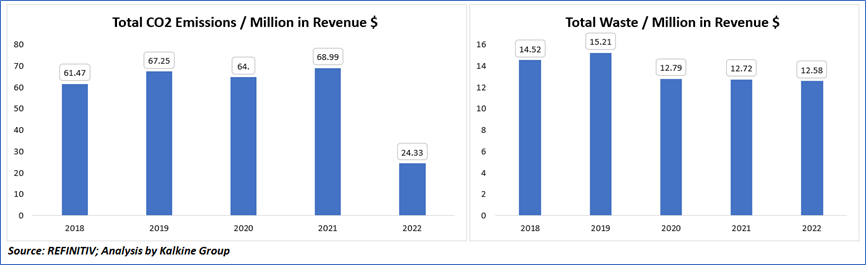
Carbon and Waste Management - Key Metrics
The total waste per million in revenue demonstrated a declining trend from 15.21 in 2019 to 12.58 in 2022, reflecting the company's improved waste management efficiency. Similarly, total CO₂ emissions per million in revenue significantly reduced from 68.99 in 2021 to 24.33 in 2022, indicating substantial progress in reducing carbon emissions relative to revenue generation.
Peer Comparison: Carbon Emission and Waste Management Metrics
AptarGroup Inc., operating within the Containers & Packaging industry, reported CO₂ equivalent emissions of 214,369 units. The company achieved an 86.00% waste recycling ratio, reflecting its commitment to sustainability. AptarGroup has set an emission reduction target of 82.50% by the year 2030, aligning with its long-term environmental sustainability goals. AptarGroup Inc.'s higher waste recycling ratio of 86.00% and ambitious emission reduction target of 82.50% by 2030 position the company ahead of several peers in the Containers & Packaging industry. This demonstrates its strong environmental stewardship and commitment to achieving substantial sustainability milestones within a shorter timeframe compared to peers with lower targets or longer timelines.

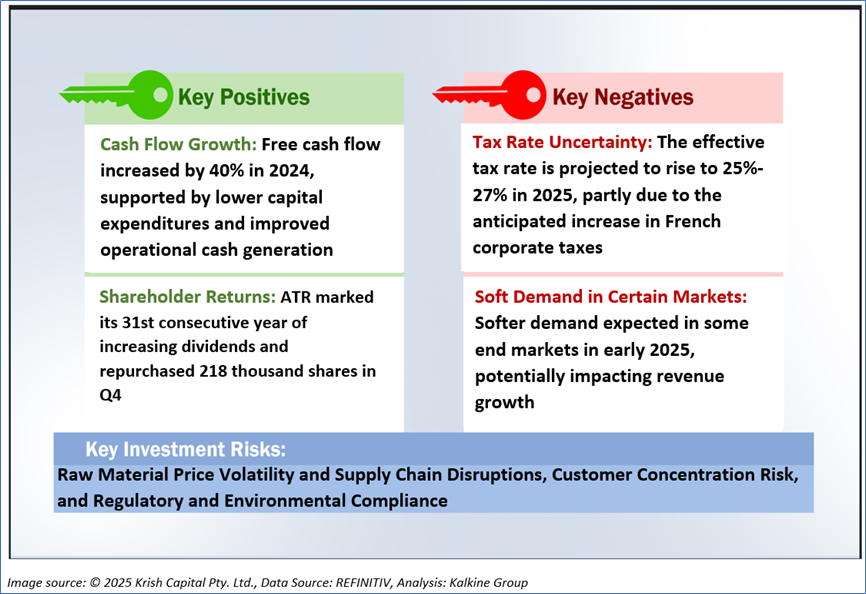
1.2 The Key Positives, Negatives, and Investment summary

1.3 Top 10 shareholders:
The top 10 shareholders together form ~29.56% of the total shareholding, signifying diverse shareholding. The Vanguard Group, Inc. and BlackRock Institutional Trust Company, N.A. are the biggest shareholders, holding the maximum stake in the company at 10.82% and 8.28%, respectively.

1.4 Key Metrics
AptarGroup Inc.'s profitability metrics demonstrated a decline in Q4FY24 compared to Q4FY23, with Gross Profit Margin reducing from 30.9% to 29.6%, EBITDA Margin from 22.5% to 20.8%, and Operating Margin from 14.6% to 13.1%. Similarly, the Income before Tax Margin contracted to 9.6% from 13.7%, while the Net Margin decreased to 7.4% from 11.9%. The company's Income Tax Rate rose to 22.8% from 13.1%, contributing to the lower net margin. Additionally, Return on Average Common Equity declined to 13.1%, Return on Average Total Assets to 6.6%, and Return on Invested Capital to 9.4% on a trailing twelve-month (TTM) basis. However, the company's Free Cash Flow Yield remained relatively stable at 3.1% compared to 3.3% in the prior year.

Section 2: Business Updates and Corporate Business Highlights
2.1 Recent Updates:
The below picture gives an overview of the recent updates:

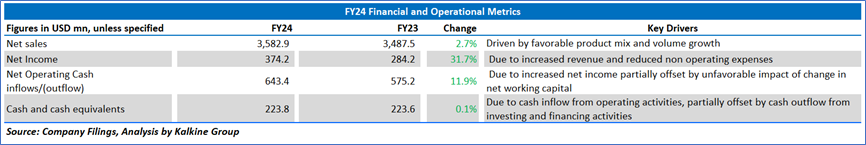
2.2 Insights of FY24:
Section 3: Key Risks & Outlook


Section 4: Stock Recommendation Summary:
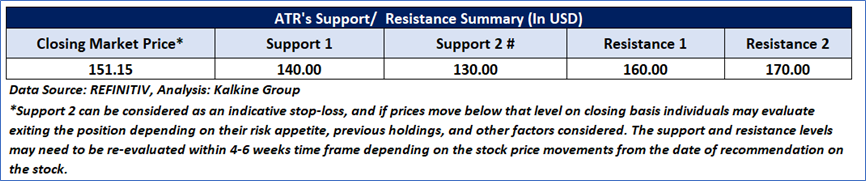
4.1 Price Performance and Technical Summary:
Stock Performance:

4.2 Fundamental Valuation
Valuation Methodology: Price/Earnings Per Share Multiple Based Relative Valuation

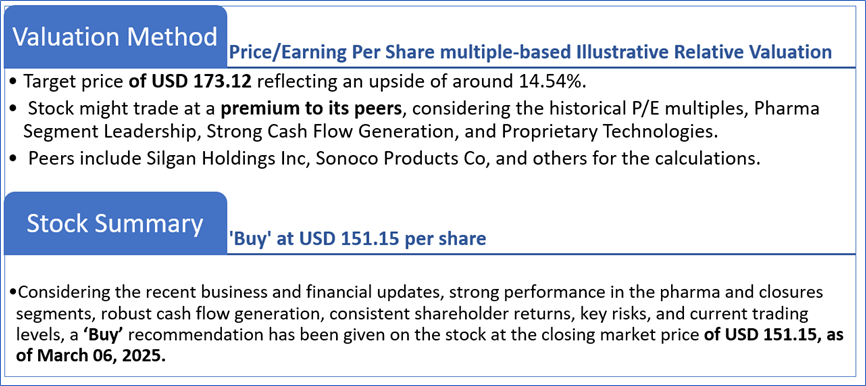
Markets are trading in a highly volatile zone currently due to certain macroeconomic issues and geopolitical tensions prevailing. Therefore, it is prudent to follow a cautious approach while investing.
Note 1: Past performance is not a reliable indicator of future performance.
Note 2: The reference date for all price data, currency, technical indicators, support, and resistance levels is March 06, 2025. The reference data in this report has been partly sourced from REFINITIV.
Note 3: Investment decisions should be made depending on an individual's appetite for upside potential, risks, holding duration, and any previous holdings. An 'Exit' from the stock can be considered if the Target Price mentioned as per the Valuation and or the technical levels provided has been achieved and is subject to the factors discussed above.
Note 4: The report publishing date is as per the Pacific Time Zone.
Technical Indicators Defined: -
Support: A level at which the stock prices tend to find support if they are falling, and a downtrend may take a pause backed by demand or buying interest. Support 1 refers to the nearby support level for the stock and if the price breaches the level, then Support 2 may act as the crucial support level for the stock.
Resistance: A level at which the stock prices tend to find resistance when they are rising, and an uptrend may take a pause due to profit booking or selling interest. Resistance 1 refers to the nearby resistance level for the stock and if the price surpasses the level, then Resistance 2 may act as the crucial resistance level for the stock.
Stop-loss: It is a level to protect against further losses in case of unfavorable movement in the stock prices.
Disclaimer This report has been issued by Kalkine New Zealand Limited (FSP691351) (NZBN:9429047678101) (“Kalkine”). Kalkine is a Financial Advice Provider (“FAP”) and is authorised by a Class 1 Financial Advice Provider Licence issued by Financial Markets Authority (“FMA”) to provide financial advice. Kalkine provides only general financial advice through its research reports following a person becoming a member. The reports contain buy/sell/hold and other recommendations in relation to equity securities, managed funds and other managed investment schemes and other financial advice products. The recommendations and opinions in this report and on Kalkine website do not take into account any of your investment objectives, financial situation or needs. Before you make a decision about whether to acquire a financial product, you should obtain the Product Disclosure Statement from the product issuer. You should consider the appropriateness of advice taking into account your own objectives, financial situation and needs and seek independent financial advice before making any financial decisions. If you act on the advice in the research reports, you may have to pay fees, expenses or other amounts (but not to Kalkine). Further information about the complaints and dispute resolution process, as well as information about Kalkine’s duties are available on Kalkine’s website. Please read our Financial Advice Provider (FAP) disclosure statement and Complaints Handling Guide, which are available on the website.
Past performance is not a reliable indicator of future performance.
 Please wait processing your request...