
Section 1: Company Overview and Fundamentals
1.1 Company Overview:
Apple Inc. (NASDAQ: AAPL) designs, manufactures and markets smartphones, personal computers, tablets, wearables and accessories, and sells a variety of related services. Its product categories include iPhone, Mac, iPad, and Wearables, Home and Accessories. Its software platforms include iOS, iPadOS, macOS, watchOS, visionOS, and tvOS. Its services include advertising, AppleCare, cloud services, digital content and payment services.
Kalkine’s American Tech Report covers the Company Overview, Key positives & negatives, Investment summary, Key investment metrics, Top 10 shareholding, Business updates and insights into company recent financial results, Key Risks & Outlook, Price performance and technical summary, Target Price, and Recommendation on the stock.
Price Performance:

1.2 The Key Positives, Negatives, and Investment summary

1.3 Top 10 shareholders:
The top 10 shareholders together form ~28.80% of the total shareholding, signifying concentrated shareholding. The Vanguard Group, Inc. And BlackRock Institutional Trust Company, N.A., are the biggest shareholders, holding the maximum stake in the company at ~9.34% and ~4.92%, respectively.

1.4 Key Metrics:
Apple Inc. showcased a robust financial performance from FY23 to FY24, with key profitability metrics reflecting operational excellence despite a slight decline in return on invested capital. The gross profit margin improved from 44.13% to 46.21%, indicating enhanced cost efficiency in production, while the EBITDA margin rose from 32.83% to 34.44% and the operating margin increased from 29.82% to 31.51%, underscoring Apple’s ability to optimize operations and drive higher earnings. The income before tax margin edged up from 29.67% to 31.58%, though a higher income tax rate of 15.79% in FY24 (up from 14.72%) moderated the net margin growth to 26.59% from 25.31%, reflecting a slight increase in tax burdens. Return on average common equity improved marginally from 171.95% to 174.62% and return on average total assets rose from 27.50% to 28.98%, demonstrating stronger returns for shareholders and better asset utilization, though return on invested capital dipped slightly from 58.02% to 55.35%, possibly due to increased capital investments like the USD 500 billion U.S. expansion plan, highlighting a trade-off between growth initiatives and capital efficiency. Overall, Apple’s financial health remains strong, with significant improvements in profitability and returns, tempered by minor challenges in tax and capital metrics.

Section 2: Business Updates and Financial Highlights
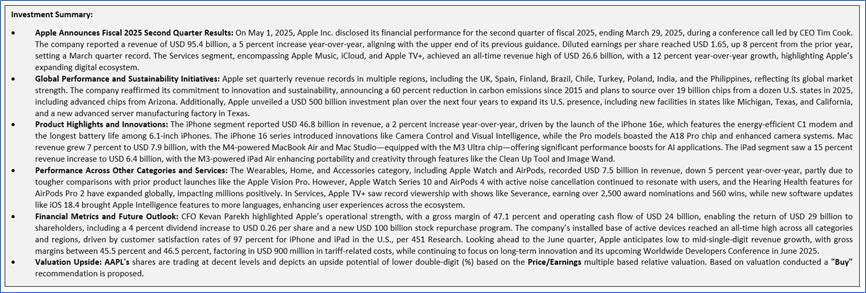
2.1 Recent Updates:
The below picture gives an overview of the recent updates:

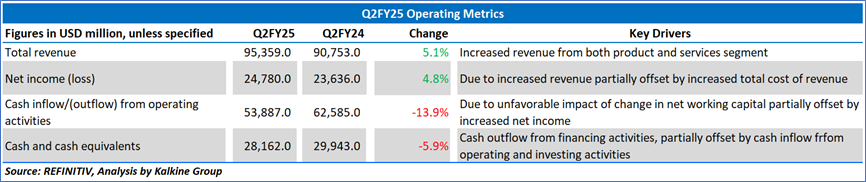
2.2 Insights of Q2FY25:
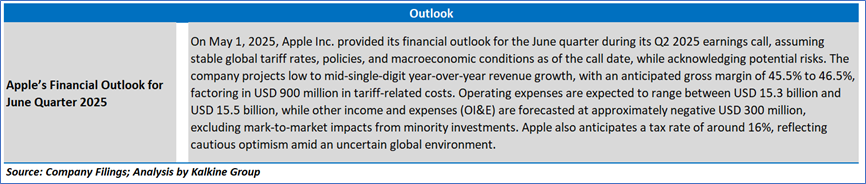
Section 3: Key Risks and Outlook:

Section 4: Stock Recommendation Summary:
4.1 Technical Summary:
Price Performance:


4.2 Fundamental Valuation
Valuation Methodology: Price/Earnings Multiple Based Relative Valuation


Markets are trading in a highly volatile zone currently due to certain macroeconomic issues and geopolitical tensions prevailing. Therefore, it is prudent to follow a cautious approach while investing.
Note 1: Past performance is not a reliable indicator of future performance.
Note 2: The reference date for all price data, currency, technical indicators, support, and resistance levels is May 12, 2025. The reference data in this report has been partly sourced from REFINITIV.
Note 3: Investment decisions should be made depending on an individual's appetite for upside potential, risks, holding duration, and any previous holdings. An 'Exit' from the stock can be considered if the Target Price mentioned as per the Valuation and or the technical levels provided has been achieved and is subject to the factors discussed above.
Note 4: The report publishing date is as per the Pacific Time Zone.
Technical Indicators Defined: -
Support: A level at which the stock prices tend to find support if they are falling, and a downtrend may take a pause backed by demand or buying interest. Support 1 refers to the nearby support level for the stock and if the price breaches the level, then Support 2 may act as the crucial support level for the stock.
Resistance: A level at which the stock prices tend to find resistance when they are rising, and an uptrend may take a pause due to profit booking or selling interest. Resistance 1 refers to the nearby resistance level for the stock and if the price surpasses the level, then Resistance 2 may act as the crucial resistance level for the stock.
Stop-loss: It is a level to protect against further losses in case of unfavorable movement in the stock prices.
Disclaimer This report has been issued by Kalkine New Zealand Limited (FSP691351) (NZBN:9429047678101) (“Kalkine”). Kalkine is a Financial Advice Provider (“FAP”) and is authorised by a Class 1 Financial Advice Provider Licence issued by Financial Markets Authority (“FMA”) to provide financial advice. Kalkine provides only general financial advice through its research reports following a person becoming a member. The reports contain buy/sell/hold and other recommendations in relation to equity securities, managed funds and other managed investment schemes and other financial advice products. The recommendations and opinions in this report and on Kalkine website do not take into account any of your investment objectives, financial situation or needs. Before you make a decision about whether to acquire a financial product, you should obtain the Product Disclosure Statement from the product issuer. You should consider the appropriateness of advice taking into account your own objectives, financial situation and needs and seek independent financial advice before making any financial decisions. If you act on the advice in the research reports, you may have to pay fees, expenses or other amounts (but not to Kalkine). Further information about the complaints and dispute resolution process, as well as information about Kalkine’s duties are available on Kalkine’s website. Please read our Financial Advice Provider (FAP) disclosure statement and Complaints Handling Guide, which are available on the website.
Past performance is not a reliable indicator of future performance.
 Please wait processing your request...