
Kalkine’s Global Tariff Report provides fully independent analysis and data-driven analysis of major global sectors affected by tariff changes, evaluating the implications these shifts may have on equity valuations across those industries. The report concentrates on trade-sensitive sectors that typically experience heightened investor scrutiny during periods of tariff uncertainty. It also identifies defensive and countercyclical segments that demonstrate relative resilience or may even outperform, amid disruptions to global trade flows.
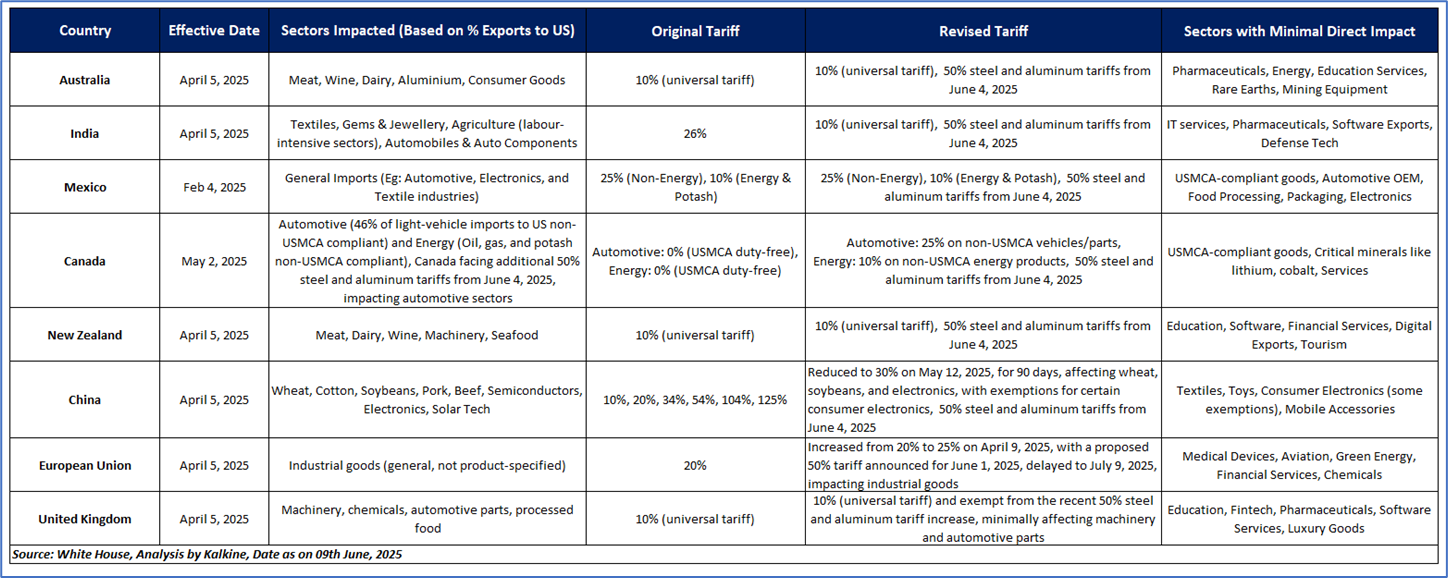
As illustrated in the table below, several key sectors in different countries are directly impacted by the recent tariff announcement from President Trump.

Key Developments (June 2, 2025)
United States: Legal Challenges and Strategic Shifts
European Union: Responses and Negotiations


In April 2025, the United States saw a significant improvement in its trade imbalance, with the trade deficit narrowing to USD 62 billion from USD 140 billion in March, driven by a rise in total exports to USD 289 billion and a sharp decline in imports to USD 351 billion, reflecting the impact of tariffs and reduced consumer demand. Goods exports increased to USD 188.47 billion, while service exports reached USD 162.53 billion, maintaining a strong services surplus, though the 30% tariff on Chinese goods and retaliatory measures continue to threaten goods-exporting sectors, necessitating cautious economic strategies amidst a still-elevated external debt of USD 27.6 trillion and potential macroeconomic risks.


The U.S. economy is currently grappling with significant challenges, including high inflation, supply chain disruptions, and the effects of aggressive monetary policy from the Federal Reserve. Key sectors such as manufacturing, agriculture, and technology are feeling strain, particularly due to their dependence on global supply chains and export markets, with trade policies like tariffs on steel, aluminum, and electronics driving up costs for businesses and consumers alike. Despite these pressures, there’s cautious optimism in some quarters about market stabilization within the next year, though this is tempered by ongoing issues like labor shortages, energy price volatility, and political divisions. The Federal Reserve’s interest rate hikes aimed at curbing inflation—still above target levels—have slowed economic growth, raising recession risks, while strategic efforts such as trade agreements and supply chain diversification remain critical to fostering stability and mitigating prolonged uncertainty across these vital sectors.


Amid elevated Market Volatility and Tariff pressures, Airbnb Inc. (NASDAQ: ABNB) stands out as our defensive pick within the Travel & Hospitality Industry, supported by rigorous fundamental and technical research
Kalkine’s Global Tariff Report covers the Investment Highlights, Key Financial Metrics, Risks, Technical Analysis along with the Valuation, Target Price, and Recommendation on the Airbnb, Inc. (NASDAQ: ABNB).
Section 1: Company Overview and Fundamental Insights
1.1 Company Overview:
Airbnb, Inc. (NASDAQ: ABNB) operates a global platform for stays and experiences. The Company’s marketplace model connects hosts and guests online or through mobile devices to book spaces and experiences around the world. The Company has built its platform to onboard new hosts, especially those who previously had not considered hosting. It partners with hosts throughout the process of setting up their listing and provides them with a suite of tools to manage their listings, including scheduling, merchandising, integrated payments, community support, host protection, pricing guidance, and feedback from reviews.

1.2 The Key Positives, Negatives, Investment Highlights and Risks


1.3 Top 10 Shareholders:
The top 10 shareholders together form ~34.44% of the total shareholding. The Vanguard Group, Inc. and BlackRock Institutional Trust Company, N.A. hold a maximum stake in the company at ~8.64% and ~4.67%, respectively.

1.4 Key Metrics:
Airbnb, Inc. (Nasdaq: ABNB) has demonstrated robust financial growth from 2020 to 2024, with revenue from business activities increasing from USD 3,378.2 million to USD 11,102 million, reflecting a 4-year CAGR of 34.64%, while gross profit surged from USD 1,624.3 million to USD 7,942 million, achieving an impressive 4-year CAGR of 92.49%, driven by a consistent rise in gross margin from 48.08% in 2020 to 71.54% in 2024, as reported on June 9, 2025. Comparing Q1 FY24 to Q1 FY25, the gross profit margin slightly improved from 70.87% to 71.54%, while profitability metrics showed significant enhancement, with the EBITDA margin increasing from 15.75% to 23.58%, the operating margin rising from 15.31% to 23.00%, and the income before tax margin advancing from 21.20% to 30.00%, indicating improved operational efficiency and cost management amidst revenue growth, positioning Airbnb favorably for sustained profitability in the hospitality and travel industry.

Section 2: Business Updates and Financial Highlights
2.1 Recent Updates: The below picture gives an overview of the company’s recent activities, such as an announcement regarding dividend distribution.

2.2 Insights on Q1 2025 Financial Performance:

Section 3: Key Risks, Company Outlook:

Section 4: Stock Recommendation Summary:
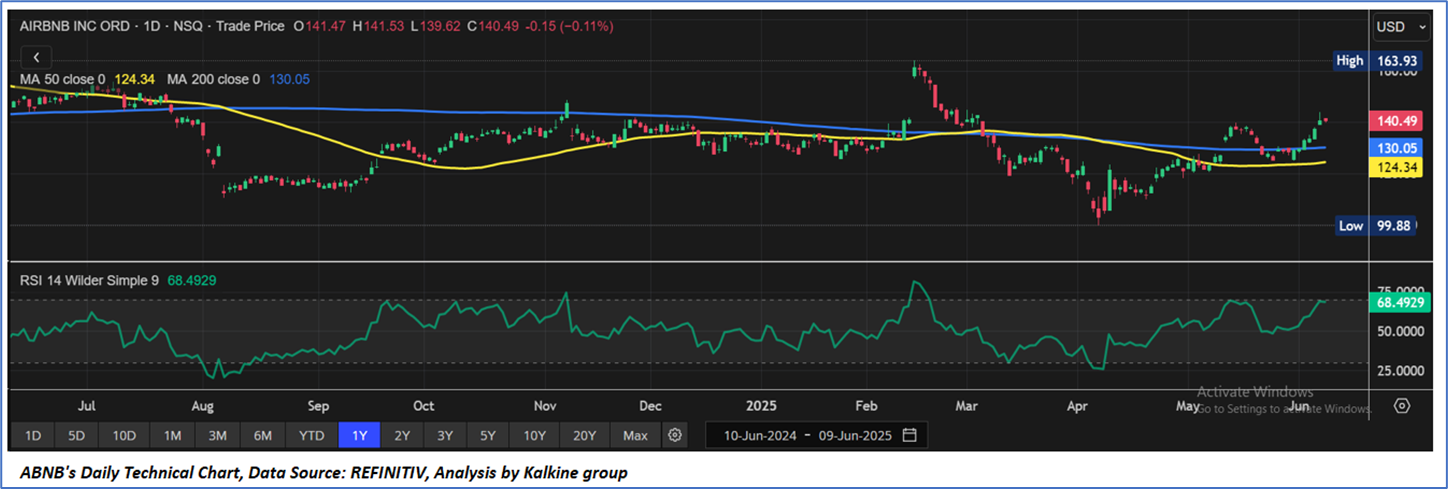
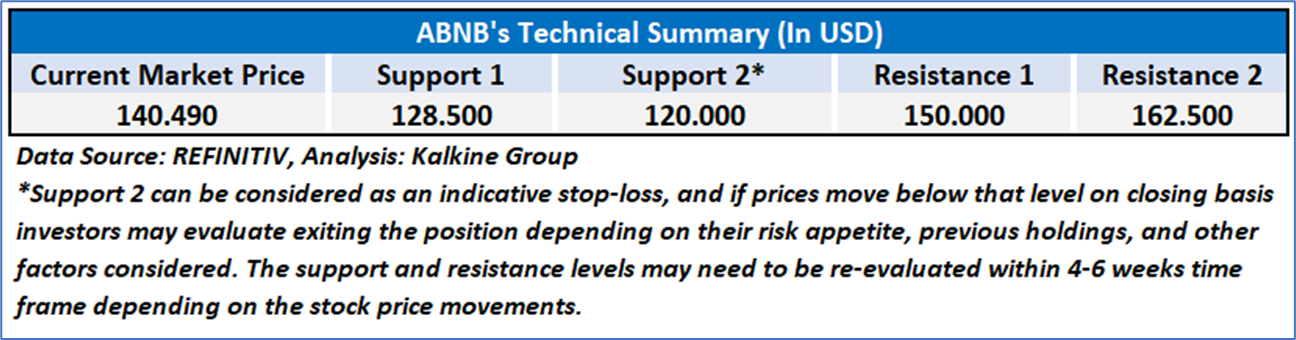
4.1 Price Performance and Technical Summary:
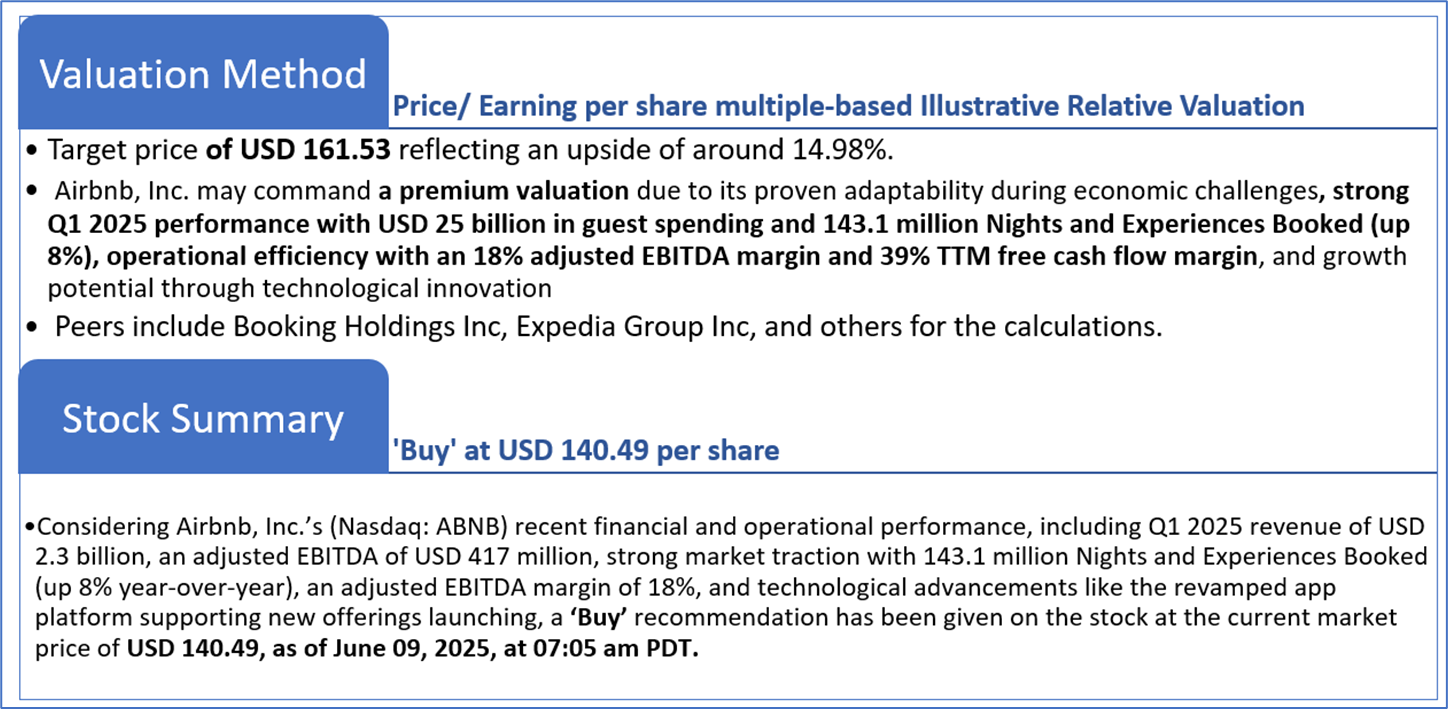
4.2 Fundamental Valuation
Valuation Methodology: Price/ Earnings Per Share Multiple Based Relative Valuation (Illustrative)

Note 1: Past performance is not a reliable indicator of future performance.
Note 2: The reference date for all price data, currency, technical indicators, support, and resistance levels as on June 09, 2025. The reference data in this report has been partly sourced from REFINITIV.
Note 3: Investment decisions should be made depending on an individual's appetite for upside potential, risks, holding duration, and any previous holdings. An 'Exit' from the stock can be considered if the Target Price mentioned as per the Valuation and or the technical levels provided has been achieved and is subject to the factors discussed above.
Note 4: Dividend Yield may vary as per the stock price movement.
Note 5: Kalkine reports are prepared based on the stock prices captured either from REFINITIV or Trading View. Typically, REFINITIV or Trading View may reflect stock prices with a delay which could be a lag of 25-30 minutes. There can be no assurance that future results or events will be consistent with the information provided in the report. The information is subject to change without any prior notice.
Technical Indicators Defined: -
Support: A level at which the stock prices tend to find support if they are falling, and a downtrend may take a pause backed by demand or buying interest.
Resistance: A level at which the stock prices tend to find resistance when they are rising, and the uptrend may take a pause due to profit booking or selling interest.
Stop-loss: In general, it is a level to protect further losses in case of any unfavorable movement in the stock prices.
Disclaimer This report has been issued by Kalkine New Zealand Limited (FSP691351) (NZBN:9429047678101) (“Kalkine”). Kalkine is a Financial Advice Provider (“FAP”) and is authorised by a Class 1 Financial Advice Provider Licence issued by Financial Markets Authority (“FMA”) to provide financial advice. Kalkine provides only general financial advice through its research reports following a person becoming a member. The reports contain buy/sell/hold and other recommendations in relation to equity securities, managed funds and other managed investment schemes and other financial advice products. The recommendations and opinions in this report and on Kalkine website do not take into account any of your investment objectives, financial situation or needs. Before you make a decision about whether to acquire a financial product, you should obtain the Product Disclosure Statement from the product issuer. You should consider the appropriateness of advice taking into account your own objectives, financial situation and needs and seek independent financial advice before making any financial decisions. If you act on the advice in the research reports, you may have to pay fees, expenses or other amounts (but not to Kalkine). Further information about the complaints and dispute resolution process, as well as information about Kalkine’s duties are available on Kalkine’s website. Please read our Financial Advice Provider (FAP) disclosure statement and Complaints Handling Guide, which are available on the website.
Past performance is not a reliable indicator of future performance.
 Please wait processing your request...